Silver Price Analysis: XAG/USD soars above $23.00 on Middle East rising tensions
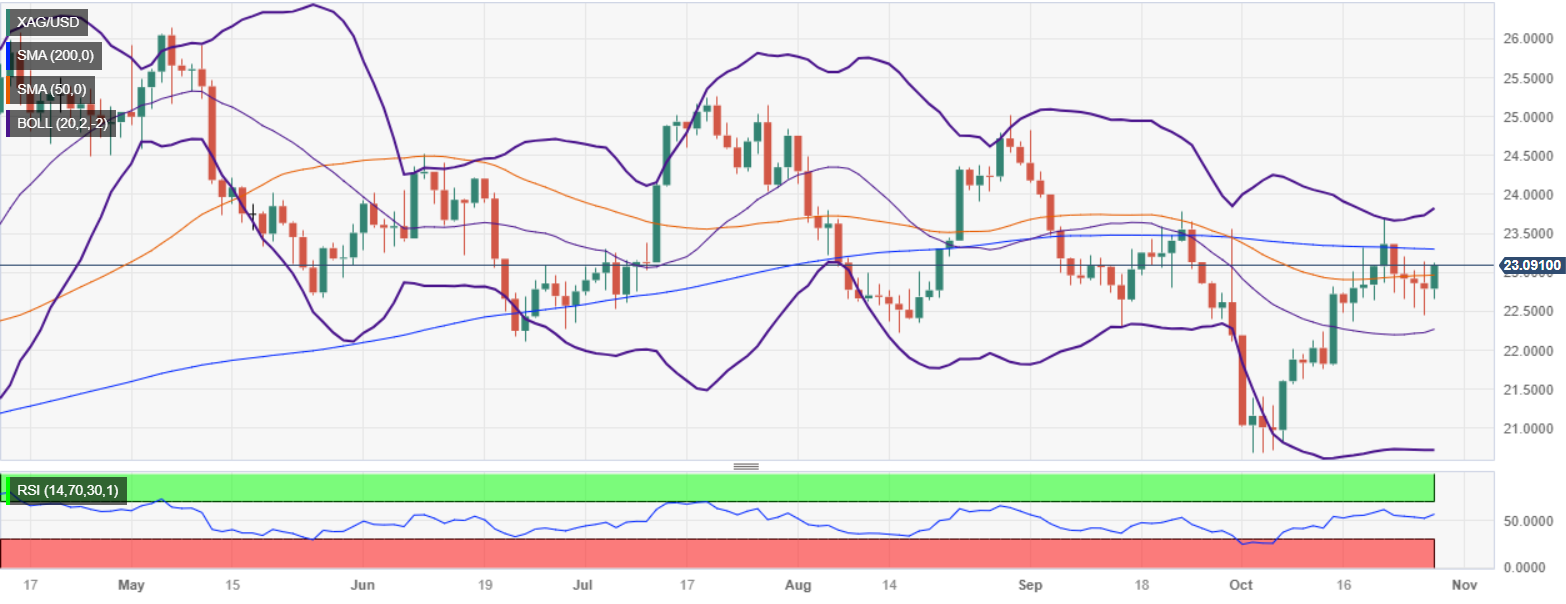
- Silver price jumps from $22.70 to $23.07, testing crucial resistance at 200-DMA of $23.26.
- A breach of 200-DMA could expose next resistance levels at $23.69 and Bollinger bands top at $23.80.
- If Silver falls below $23.00, supports are $22.94, $22.44, and 20-day EMA at $22.25.
Silver price jumped above the $23.00 figure bolstered by a risk-off impulse, amidst geopolitical headlines suggesting the Middle East conflict is escalating, as Israel began its ground offensive at the Gaza strip. That said, the XAG/USD rose from $22.70 and is trading at $23.07, gaining more than 1.35%.
The XAG/USD remains downward biased despite rising above the 50-day moving average (DMA) at $22.94, about to test the crucial resistance level at the 200-DMA at $23.26. once that level is cruised, the next ceiling level would be $23.69, the latest cycle high. In a breach of that level, Silver bias would shift to neutral upwards, exposing the top of the Bollinger bands at $23.80,
Conversely, if Silver tumbles below $23.00, that would keep the downtrend in place. The first support would be the 50-DMA at $22.94, followed by the October 26 low of $22.44, before tumbling to challenge the 20-day Exponential Moving Average (EMA) at $22.25.
XAG/USD Price Action – Daily chart

XAG/USD Technical Levels