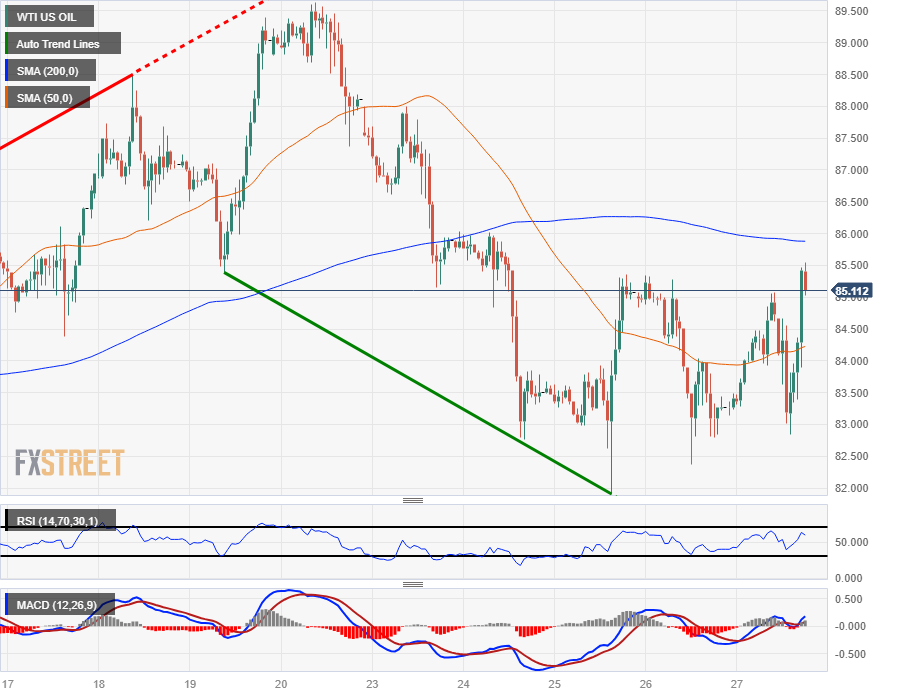
WTI taps $85.50, Crude Oil rebounds on Gaza headlines
- WTI hit $85.50 as markets react to Israel expanding ground operations in the ongoing Gaza conflict.
- Reported progress on cease-fire talks appear to be having little effect.
- Crude Oil to remain prone to upside risks as geopolitical tensions weigh.
West Texas Intermediary (WTI) shot to a three-day high above $85.00 per barrel following reports of a rapid escalation of Israeli ground attacks in Gaza, alongside complete disruption of internet and telephone communications in the Gaza Strip.
According to Paltel Group, a Palestinian telecommunications company and one of the largest employers in the entire West Bank after the Palestinian government, said that Israel's latest air-to-ground offensive bombing has completely decimated telecommunications infrastructure in Gaza.
Israeli escalation of combined ground troops and aerial attacks on "underground targets" comes a day after Iranian Foreign Minister Hossein Amirabdollahian threatened that the US "would not be spared this fire" if Israel continues to escalate against Hamas. Foreign Minister Hossein Amirabdollahian made the blustering statement while at the United Nations (UN) on Thursday.
WTI Technical Outlook
After seeing a surge into a three-day high, WTI Crude Oil is settling back towards $85.00 per barrel as short-term investors take early profits on the lastest volatility spike.
Crude Oil is now trading into the north side the week's consolidation between $85.00 and $82.00.
$82.00 is proving to be a significant technical support level, while a bearish breakdown will see barrel bids challenging the 200-day Simple Moving Average (SMA) currently parked near $78.00.
On the top side, the last swing high sits just shy of the $90.00 major psychological level, while a break above 2023's ceiling of $93.98 would see WTI setting a 14-month high at the $94.00 handle.
WTI Daily Chart

WTI Technical Levels