Breaking News: Gold price surpass $2000 on geopolitical risks
- Gold price rallies to $2000 per troy ounce, bouncing back from daily lows of $1976.97.
- Escalating Middle East conflict and Israel military expanding its operations in Gaza.
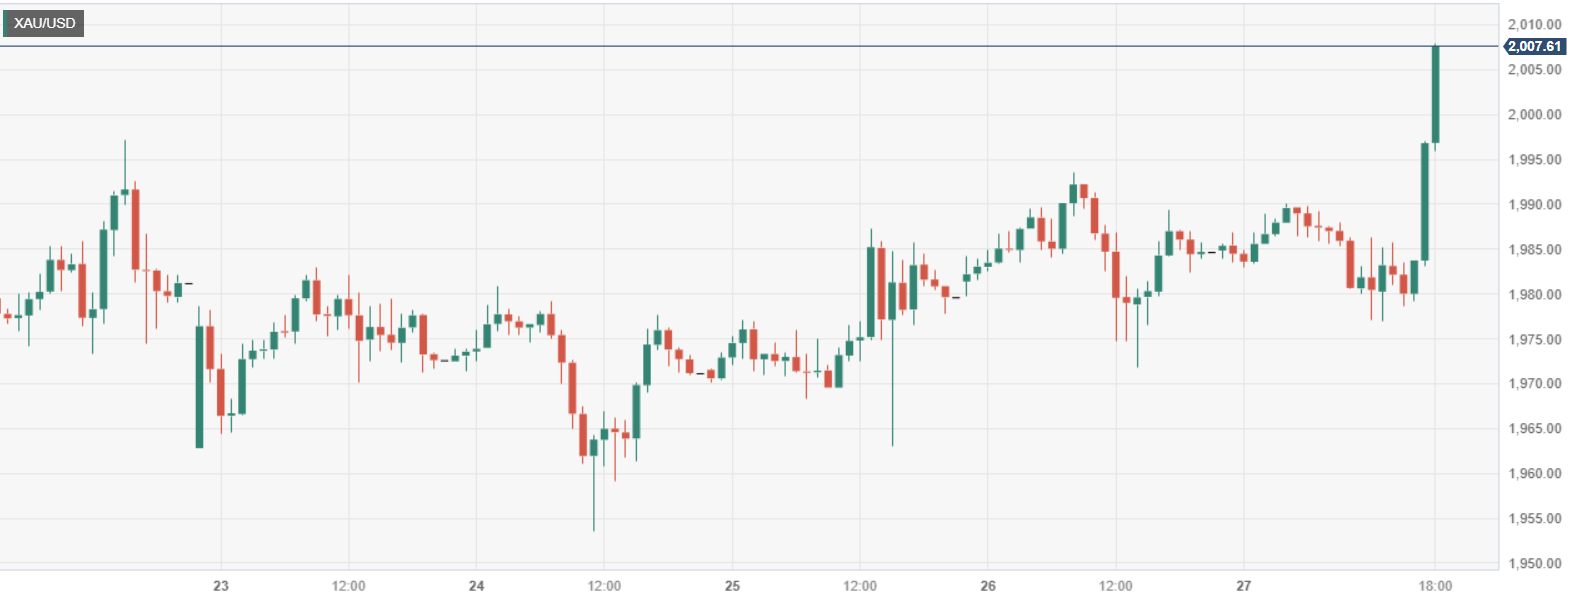
Gold price finally broke the $2000 troy ounce barrier on Friday amidst increasing geopolitical risks, as the conflict between Israel and Hamas is at the brisk of spreading towards more countries in the region. At the time of writing, XAU/USD is trading at $2000 after the yellow metal bounced from daily lows of $1972.12
XAU/USD hits a significant milestone, fueled by Middle East conflicts and a weakening US Dollar
An escalation in the Middle East conflict keeps investors on their toes. Israel expanding ground operations in Gaza, shifted market sentiment. According to the Financial Times Israel "air force launched an intense bombardment that knocked out the enclave’s telecommunications systems."
ISreael Rear Admidal Daiel Hagari, a spokesman for Israel's military said "In recent hours, we have intensified attacks on Gaza. The air force is widely attacking subterranean targets and terror targets in a significant fashion."
Paltel, a Palestinian telecommunications company said that Israel's bombardment, destroyed the remaining communications between Gaza and the outside world.
XAU/USD Reaction
Gold price skyrocketed from around $1985 towards the $2000 mark, achieving a daily high of $2006.91, with buyers eyeing the next target at around May 10 high of $2048.15. On the flip side, the first support is at $2000 a troy ounce, followed by the October 24 low of $1953.69.
