AUD/NZD Price Analysis: Aussie looking to extend gains on Kiwi, but momentum is skewing down
- The AUD/NZD is middling for Monday after a failed run towards 1.0930.
- The Aussie has gained significantly against the Kiwi for October.
- Despite gains, AUD momentum appears to be draining.
The AUD/NZD has been trending higher, with the Aussie (AUD) tapping into Friday's high for October at 1.0930, but bullish momentum is draining out of the pair for the time being.
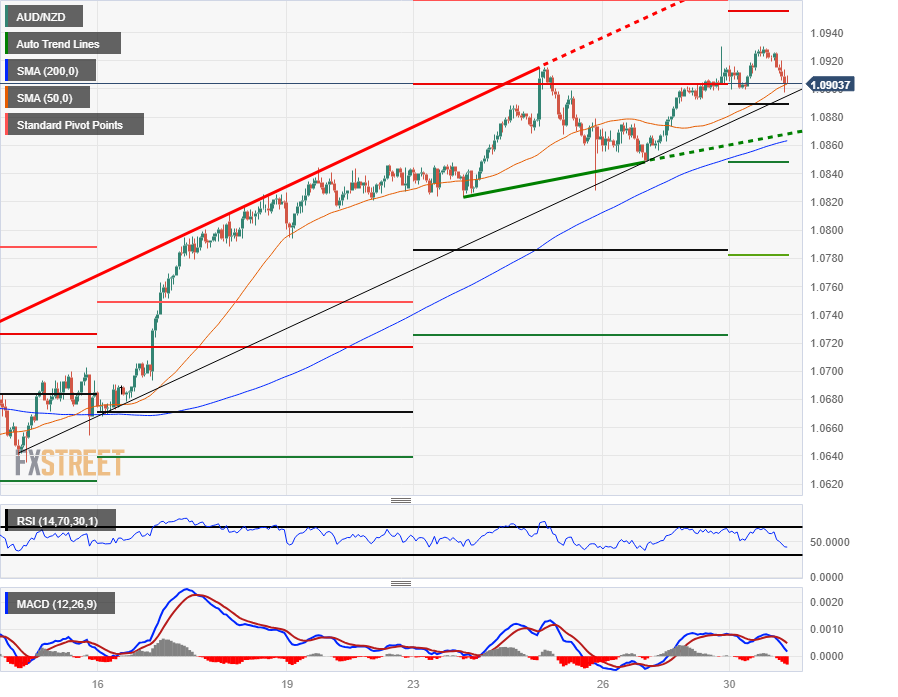
On the hourly candlesticks, the pair is knocking back into the 50-hour Simple Moving Average (SMA) technical barrier, with near-term support sitting at 1.0860 near the 200-hour SMA.
Intraday action is threatening to tip back over into the weekly P0 pivot point currently marked in near 1.0890, with P1 sitting at 1.0850 down below and bullish continuations set to run into R1 just beyond 1.0950.
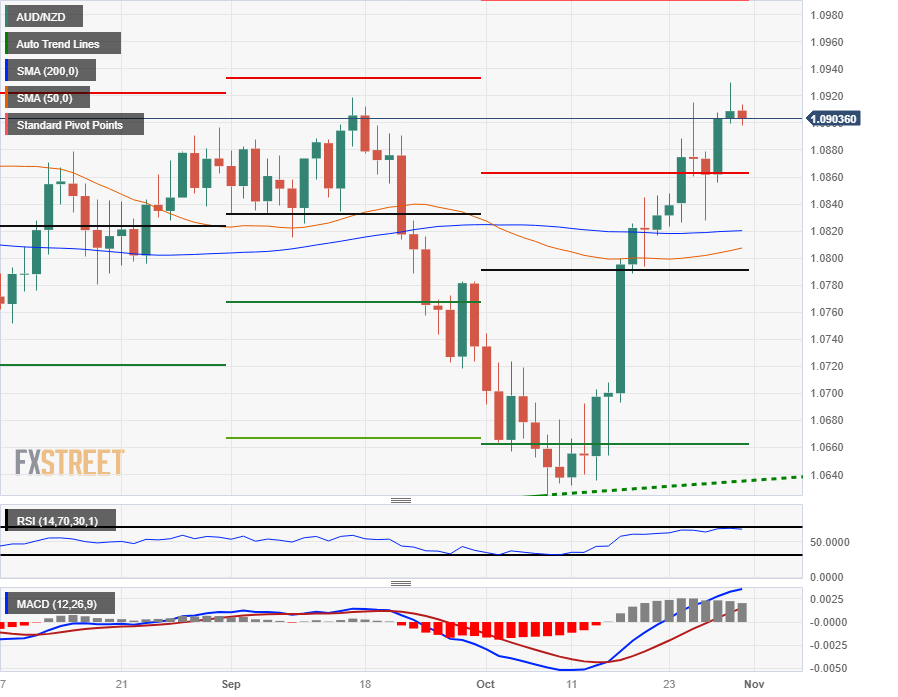
On the daily candlesticks, the AUD/NZD pair is flashing significant signs of overextension. The Relative Strength Index (RSI) and Moving Average Convergence-Divergence (MACD) indicators are both pushing firmly into overbought territory, though MCAD traders will want to wait for a bearish rollover of the fast MACD line to signal new bearish momentum.
Long-term directional bias has drifted firmly into the midrange, with the 200-day SMA flat near 1.0820, and a downside move will see a firming up of short momentum back into the monthly P0 pivot just below the 1.0800 handle.
Downside moves are likely to be capped by the R1 pivot at 1.0660, with October's low bids near 1.0640.
AUD/NZD Hourly Chart

AUD/NZD Daily Chart

AUD/NZD Technical Levels