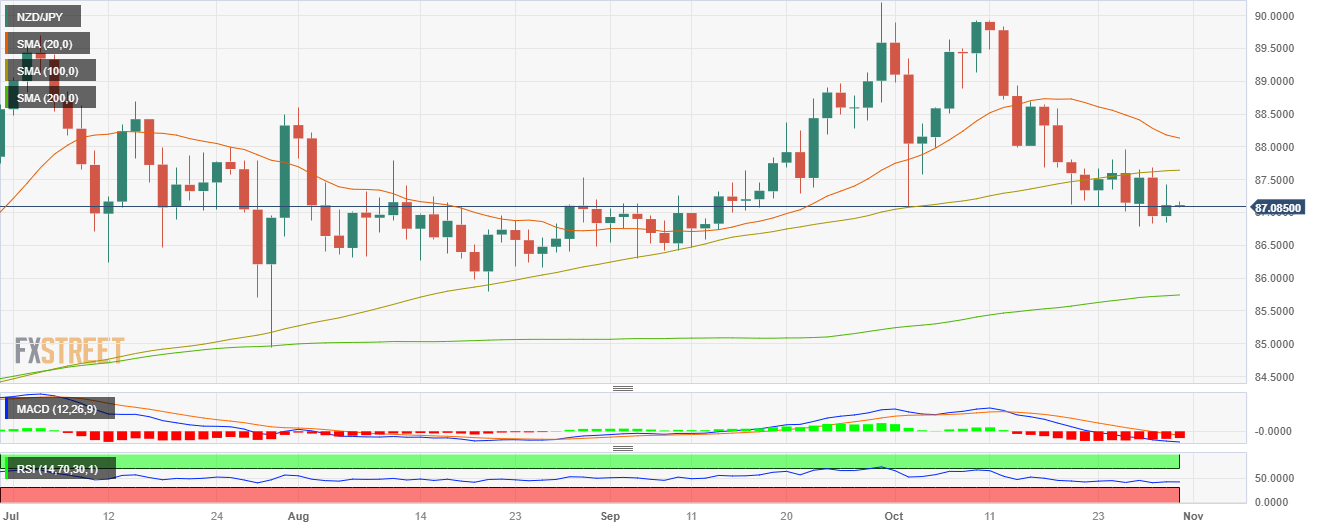
NZD/JPY secures daily gains, still bears are in command
- NZD/JPY bottomed at a low of 86.809 and then closed at 87.095.
- Bears seem to be taking a break, but indicators on the daily chart remain in negative territory.
- The 200-day SMA is the last support for the cross.
In Monday's session, the NZD/JPY closed with gains above the 87.000 level, but indicators on the daily chart suggest that the bears still have the upperhand.
In line with that, a neutral to bearish technical stance is seen for the cross in the daily chart, with the bears seeming to have taken a break after pushing down the pair by nearly 2.75% during October. The Relative Strength Index (RSI) lies flat in negative territory, while the Moving Average Convergence (MACD) displays flat red bars. That being said, the cross is still above the 200-day Simple Moving Average (SMA), suggesting that despite the recent bearish sentiment,the bulls are still resilient, holding some momentum and that sellers must increase their efforts to confirm a bearish short-term trend.
The same tendency is seen in the four-hour chart, which indicators lying flat in negative territory but with a clear downwards trend in the last sessions.
Support levels: 87.000, 86.505, 86.300.
Resistance levels: 87.620 (100-day SMA), 87.805, 88.110 (20-day SMA).
NZD/JPY Daily Chart
