AUD/NZD Price Analysis: bullish extension fails to capture 1.0950, at risk of further downside
- The AUD/NZD is trading into the top side heading into Thursday.
- The Kiwi has been lagging as economic data continues to miss the mark.
- The Aussie is stepping even deeper into overbought territory.
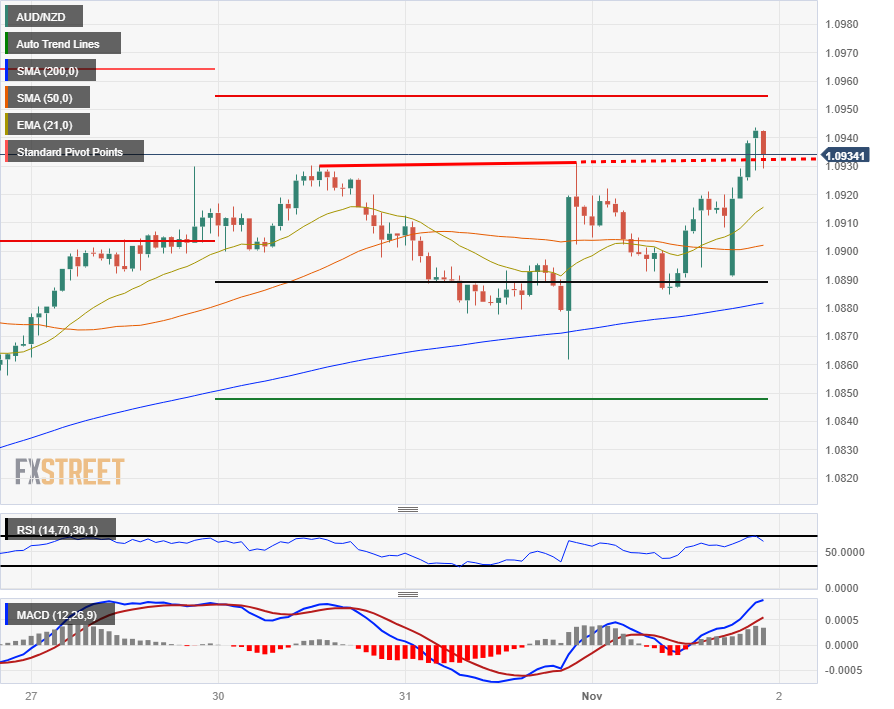
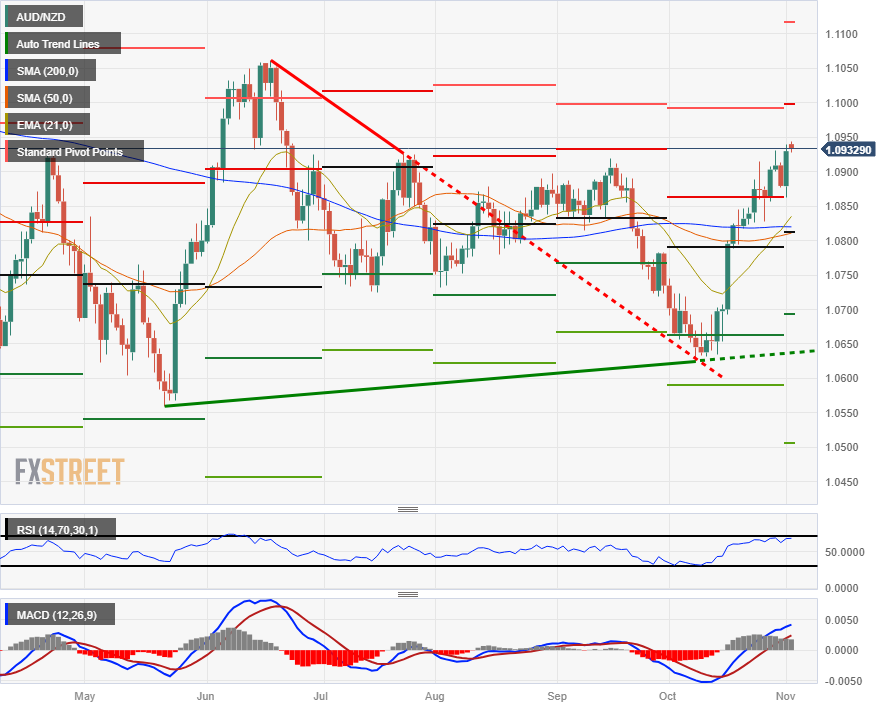
The AUD/NZD has rebounded back over the 1.0900 handle, and heads into the Thursday market session trading around 1.0930, testing into four-month highs. The trick for AUD bulls will be to keep the Aussie propped up, though the pair is getting plenty of support after a slew of economic data misses for the Kiwi this week.
Congestion within technical indicators is beginning to pile up for the AUD/NZD chart, with November's P0 neutral pivot point printing in between the 200-day and 50-day Simple Moving Averages (SMA) just north of the 1.0800 handle.
Intraday action has the pair struggling to develop the necessary momentum to claim the R1 weekly pivot, and the Aussie is increasingly at risk of running out of gas. A bearish reversal will see the pair falling back to P0 and the 200-hour SMA, with an extended decline coming up against S1 for the week at 1.0850.
AUD/NZD Hourly Chart

AUD/NZD Daily Chart

AUD/NZD Technical Levels