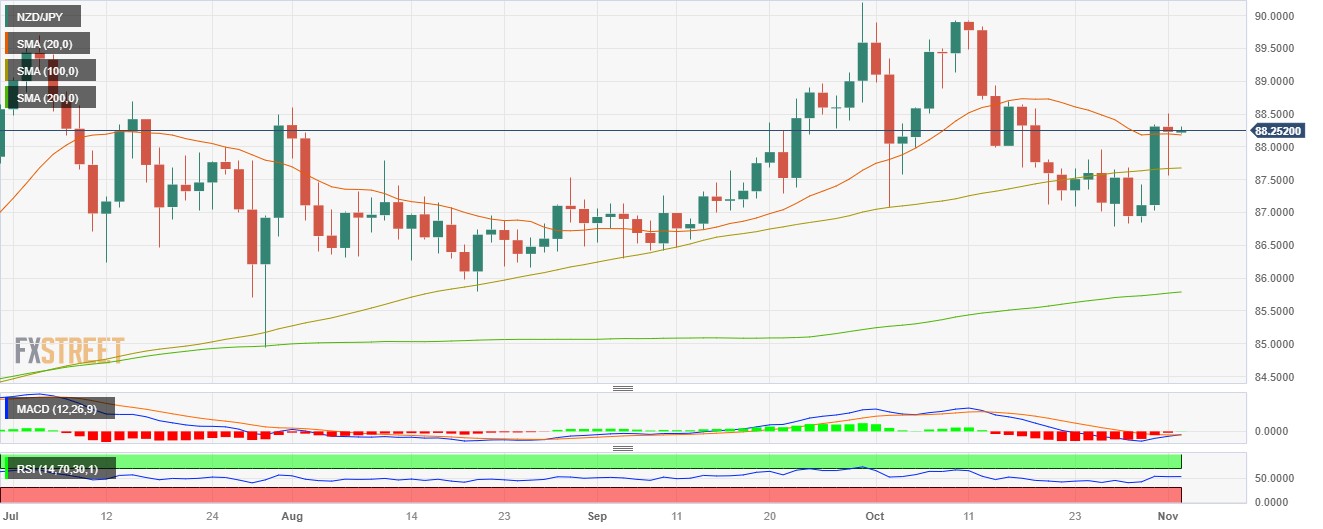
NZD/JPY buyers revive and the cross closes above the 20-day SMA
- NZD/JPY cleared most of its daily losses and closed at 88.220 after bottoming at a low of 87.556.
- The cross finished the session above the 20 and 100-day SMA.
- Indicators on the daily chart are now favouring the bulls.
In Wednesday's session, the NZD/JPY cleared daily gains and jumped from a low around the 100-day Simple Moving Avearge (SMA) to 88.220 above the 20-day SMA.
On the daily chart, indicators are showing that the bears are losing momentum, with the Relative Strength Index (RSI) standing flat above 50.00 middle points while the Moving Average Convergence Divergence (MACD) prints lower red bars. On the four-hour chart, the bullish momentum is more present, with the RSI pointing north and the MACD printing green bars.
Furthermore, on a broader scale, the bulls need to defend the 20 and 100-day SMAs to continue climbing higher. It is worth noticing that both averages seem to be converging towards 88.000 to perform a bullish cross, which, in case it happens would provide further traction to the buyers, action as a strong support.
Support levels: 88.160 (20-day SMA), 88.000, 87.700.
Resistance levels: 88.800, 0.8900, 0.8930.
NZD/JPY Daily chart
