AUD/NZD Price Forecast: Aussie down but uptrend remains intact, AUD/NZD into 1.0900
- The AUD/NZD is falling back after peaking on Wednesday.
- Antipodean cross pair is cycling familiar territory as bulls refuse to go down.
- AUD losing upside momentum could signal another turn towards the downside.
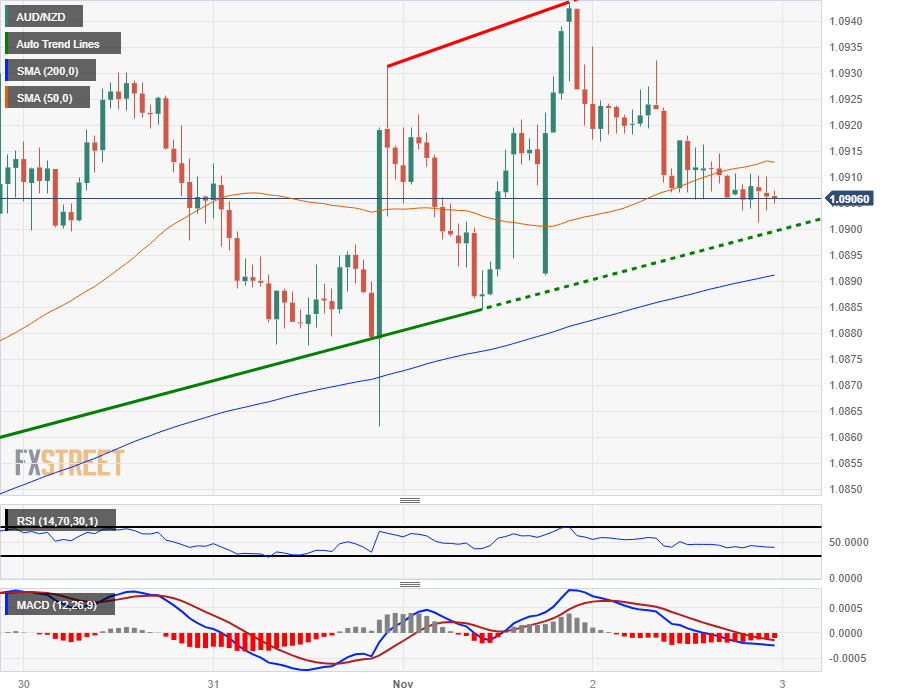
The AUD/NZD is trading back into the 1.0900 handle, a level that has been trapping the cross pair for most of 2023.
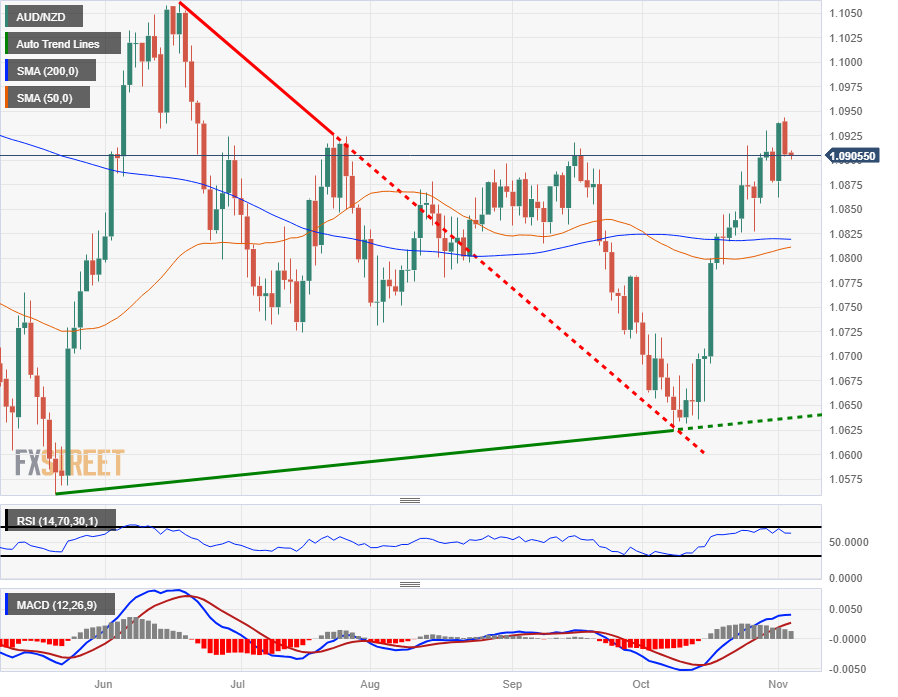
The Aussie (AUD) has seen a firm recovery since bottoming out in early October near 1.0625, but bullish momentum appears to be draining out of the charts quickly as intraday action begins to print exhaustion patterns.
On the daily candlesticks, the Relative Strength Index (RSI) has begun to roll over into a bearish trend after tipping into overbought territory last week, but traders will note that the Moving Average Convergence-Divergence (MCAD) oscillator still hasn't seen a slow-MA crossover confirming aa bearish bias in candlesticks yet.
The median point for price action currently sits near 1.0825 where the 50-day and 200-day Simple Moving Averages (SMA) are currently converging as long-term momentum drifts into the middle.
AUD/NZD Hourly Chart

AUD/NZD Daily Chart

AUD/NZD Technical Levels