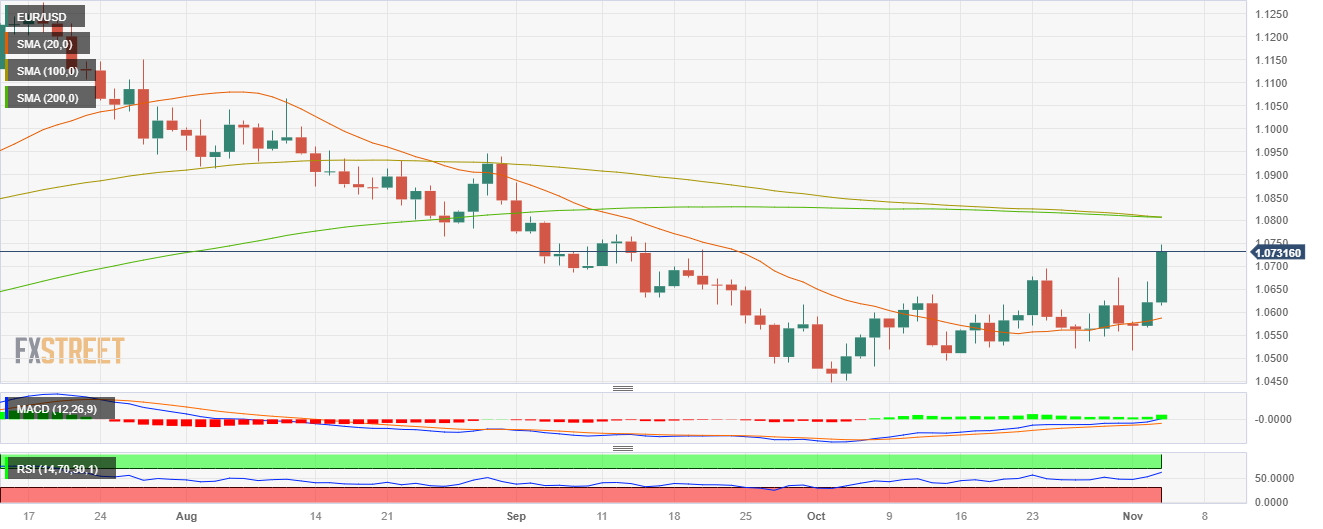
EUR/USD closes its best-performing week since June amid weak USD
- EUR/USD gained more than 1% on Friday, rising near 1.0730.
- The USD, measured by the DXY index, will close with a 1.40% weekly loss.
- The dovish stance of the Fed and weak NFPs from October made the USD tumble.
In Friday’s session, the EUR/USD soared to 1.0730, closing a 1.50% gaining week, its best performance since mid-June.
The daily market movers for the pair included a broad USD weakness due to the Federal Reserve (Fed) changing its tone to a more dovish approach and hinting that it is approaching to the end of its tightening cycle on Wednesday. As a reaction, US Treasuries tumbled to their lowest level since September, with the 2,5 and 10-year rates falling to 4.84, 4.50 and 4.57%, which added further selling pressure on the Greenback.
On Friday, the US reported that the US economy added fewer jobs than expected in October, while the unemployment rate increased to 3.9% and average hourly earnings increased lower than forecasted. As the labor market is showing signs of cooling down, it fueled additional dovish bets on the Fed and according to the CME FedWatch tool, the odds of a 25 basis point hike in December declined to nearly 9%, exacerbating the downside for the USD.
The market’s focus will now shift to the incoming data as, despite changing its tone, the Fed left the door open for further tightening. Until December, the bank will get two additional inflation readings and an extra jobs report.
EUR/USD Levels to watch
Upon evaluating the daily chart, a neutral to bullish outlook for the short term is seen, with the bulls gradually recovering their strength. The Relative Strength Index (RSI) points upwards in the bearish territory, hinting at a potential shift in momentum and bullish resurgence, while the Moving Average Convergence (MACD) histogram presents bigger green bars.
On the four-hour chart, the pair reached overbought conditions, indicating that in the immediate short term, a technical correction may be incoming.
Support levels: 1.0700, 1.0670, 1.0630.
Resistance levels: 1.0750,1.0770, 1.0800.
EUR/USD Daily Chart
