Gold Price Analysis: paddling just beneath $2,000
- Spot Gold prices head into the week's close trading into the midrange.
- XAU/USD mixed on US NFP miss.
- Near-term trend still tilted towards the upside.
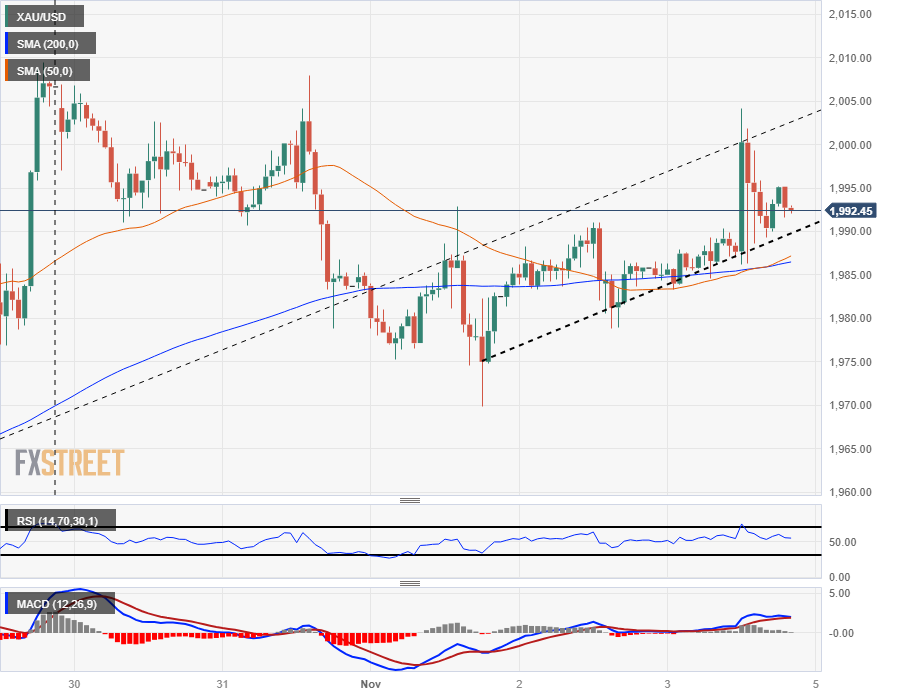
The XAU/USD bid into an intraday high just shy of $2,005 on Friday following the worst read on US Nonfarm Payrolls (NFP) in almost 3 years, but Gold bids recovered to the midrange of the day's trading to finish up near $1,992.50.
The US NFP report missed expectations, showing the US added only 150 thousand jobs in October compared to September's bumper reading of 297 thousand jobs additions, which saw a downside revision from the initial print of 336K. Markets initially expected an October reading of 180K, and the headline miss has global markets surging into the trading week's close as investors cheer the heralded end of Federal Reserve (Fed) rate hikes.
US Nonfarm Payrolls increase by 150,000 in October vs. 180,000 forecast
Gold initially tapped a weekly high of $2,008 on Tuesday before swinging into a weekly low of $1,970.
Despite the NFP miss, Gold struggled to etch in firm gains as cooler metal heads prevail; despite cooling US data, inflation and excess wage growth remain key factors for the Fed, and a single bad NFP reading will do little to push the Fed off of their "higher-for-longer" stance on interest rates.
Money markets are currently pricing in odds of a full percentage rate cute by the end of 2024, a look-ahead that could stand to be premature as the Fed grapples with getting a firm grasp on price volatility.
XAU/USD Technical Outlook
Spot Gold bids are etching in the beginning stages of a rising channel in the near-term, and bids are leaning towards the bullish side with XAU/USD intraday action trading on the north side of the 200-hour Simple Moving Average (SMA) currently rising from $1,985.
Spot Gold has been trading on the top side of the 200-day SMA currently grinding towards $1,940, and Friday's knock back from the $2,000 major handle sees XAU/USD backing away in preparation for another topside run next week.
XAU/USD Hourly Chart

XAU/USD Technical Levels