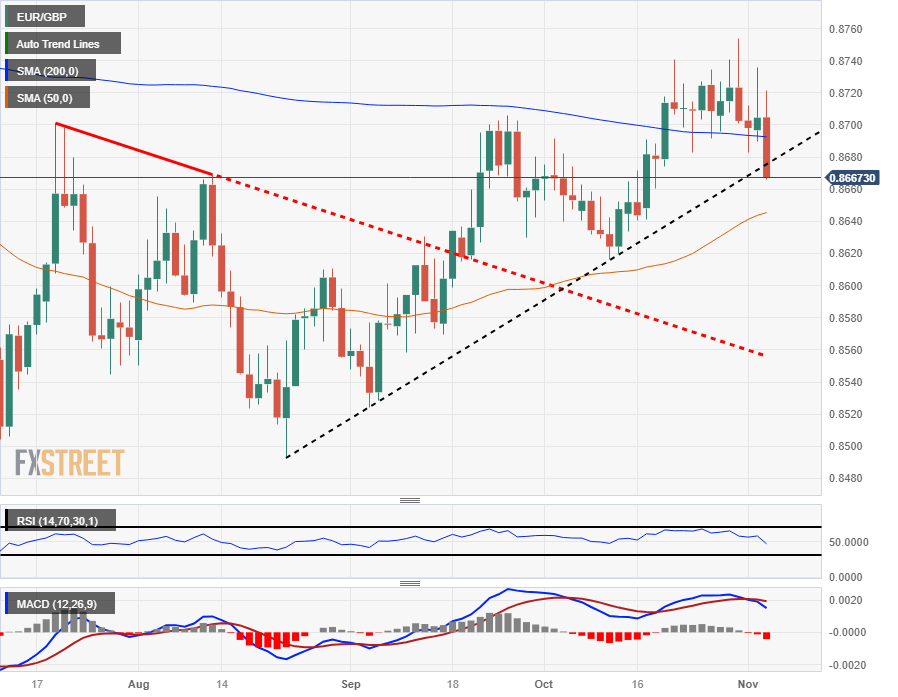
EUR/GBP tumbles to half-month low as Pound Sterling recovers
- The EUR/GBP is backsliding into 0.8660 as Pound Sterling sees a Friday rebound.
- EU Retail Sales, UK GDP on the back half of next week's economic calendar.
- GBP the big winner for Friday.
The EUR/GBP is skidding towards 0.8660 as the market heads into the closing bell for the week, and the Pound Sterling (GBP) recovery from recent months-long lows is taking the EUR/GBP down into bids not seen in almost three weeks.
The Euro (EUR) traded mostly flat against the Pound Sterling in a rough range this week before a broad-market sentiment recovery on the back of a missed US Nonfarm Payrolls (NFP) report sparked risk appetite for investors heading into the eleventh hour.
GBP set for a repeat volatility surge next Friday, UK GDP in the pipe
The back half of next week sees top-tier data for both the EU and the UK, with EU Retail Sales on Wednesday and UK Gross Domestic Product (GDP) figures on the docket for next Friday.
EU Retail Sales are currently expected to decline further for the year into September, forecast at -3.1% compared to the previous -2.1%, while UK GDP is expected to soften for the 3rd quarter, forecast to print at -0.1% compared to the previous quarter's 0.2%.
EUR/GBP Technical Outlook
The EUR/GBP's Friday softening sees the pair tumbling directly towards 0.8660, running into a rising trendline from mid-August's low just beneath 0.8500.
The pair has slipped away from long-term median prices, declining from the 200-day Simple Moving Average (SMA) which is currently drifting lower from the 0.8700 handle.
Near-term technical support for the EUR/GBP sits at the 50-day SMA leaning bullish from the 0.8640 level, and investors will want to keep an eye out for any wobbling in the pair's bids as prices battle it out for a clean break of the bullish trendline.
EUR/GBP Daily Chart

EUR/GBP Technical Levels