WTI reaches three-month highs due to easing US inflation, USD weakness
- Western Texas Intermediate (WTI), the US crude oil benchmark, rallied more than 1.70% on Thursday, hitting a new three-month high amid easing US inflation data.
- Recent Consumer and Producer Price Indices (CPI and PPI) figures in the United States showed modest climbs, sparking speculation that the US interest rate could be peaking soon.
- Higher US interest rates, which often boost the US Dollar and slow economic growth, typically dampen demand for crude oil.
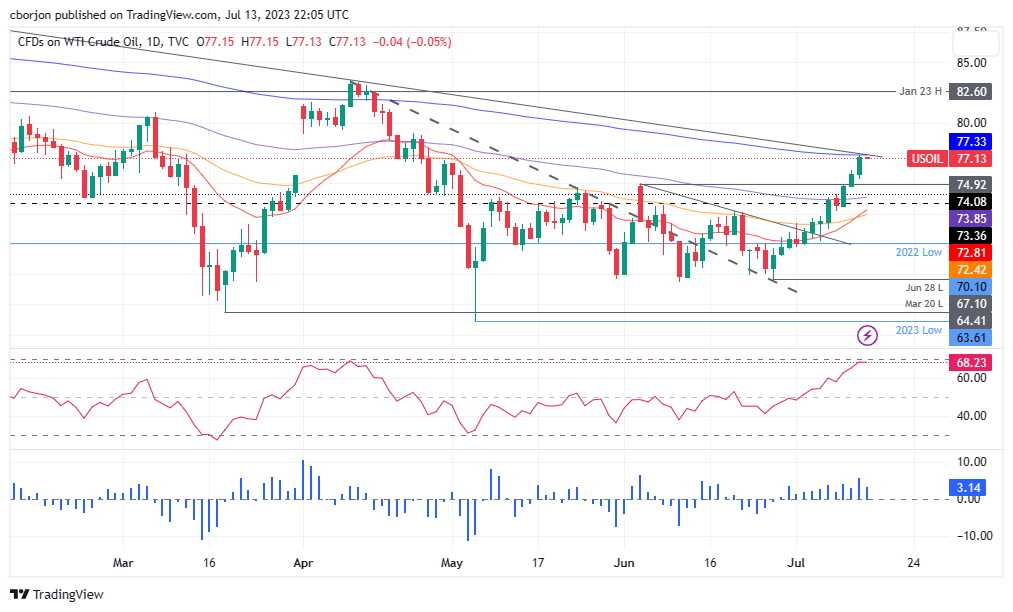
Western Texas Intermediate (WTI), the US crude oil benchmark, rallied sharply on Thursday, more than 1.70%, and hit a new three-month high, following two inflation reports that could warrant the Fed of overtightening monetary conditions. At the time of writing, WTI exchanges hands at $77.10, slightly down as the Asian session begins.
Rising oil demand forecasts and the soft US Dollar boosted WTI prices
Inflation data in the United States (US) continued its downward trajectory, with Consumer and Producer Price Indices (CPI and PPI) figures climbing modestly, spurring speculations that the US central bank might refrain from lifting rates past the July FOMC’s meeting.
Higher interest rates in the US usually boost the US Dollar (USD) and tend to slow economic growth, denting demand for crude oil. In the meantime, the US Dollar Index (DXY) dropped to its lowest level since April 2022, helping to boost WTI prices, as the DXY sits at 99.778, down 0.80%.
In the meantime, the International Energy Agency (IEA) revealed that oil demand would increase and reach a record high, despite global tightened monetary conditions and economic headwinds.
Despite the current economic weakness, the Organization of Petroleum Exporting Countries (OPEC) updated its oil demand, which remained upbeat. The cartel raised the growth forecast for the rest of 2023 and a slight economic slowdown in the next year.
WTI Price Analysis: Technical outlook

Given the fundamental backdrop, WTI’s price action left oil’s price close to testing the 200-day Exponential Moving Average (EMA) at $77.34, which, once cleared, could open WTI’s path to challenge $80.00 per barrel. Also, a downslope trendline drawn from November highs passes nearby the 200-day EMA, making its break an essential achievement for oil bulls. Once cleared, the next resistance would be the psychological $80.00, followed by the January 23 swing high at $82.60. Failure to conquer the 200-day EMA will leave WTI’s exposed to selling pressure. Key support levels lie at $77.00, the $76.00 figure and the June 5 daily high turned support at $74.92.