GBP/JPY pierces 185.00 as Pound Sterling surges
- The GBP/JPY is climbing on Friday, tipping into 2-month highs.
- The Pound Sterling is lurching higher as market risk appetite returns.
- GBP set for its best weekly performance in five months.
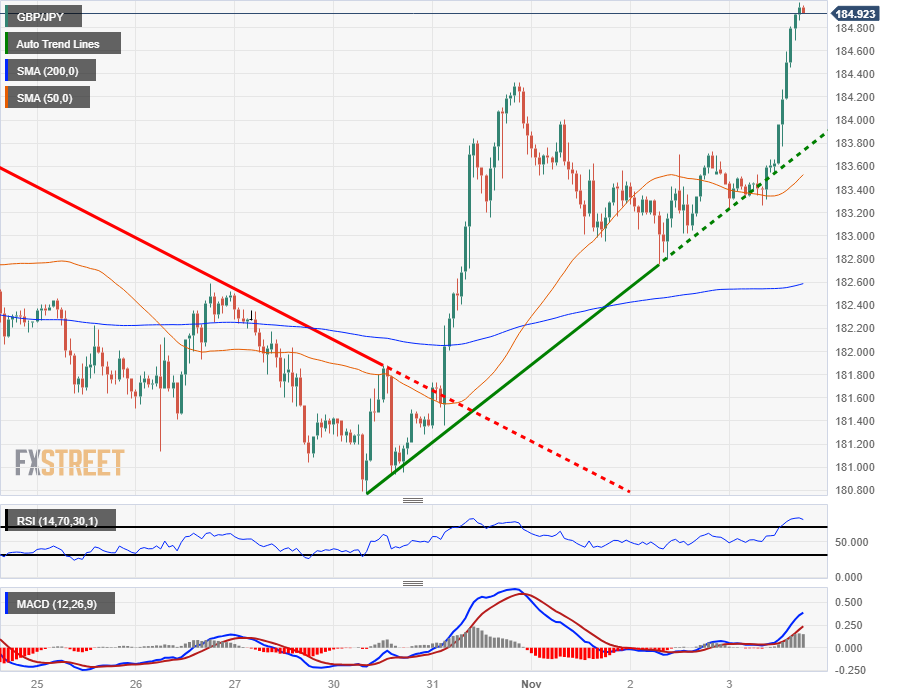
The GBP/JPY has pierced the 185.00 handle as the market heads into the final hours of the trading week, pushing into an 8-week high as broad market risk appetite finds a firm recovery.
The Japanese Yen (JPY) has been on the back foot after a dovish Bank of Japan (BoJ) recently ruined all of their own hard work in verbally defending the beleaguered JPY.
The Pound Sterling (GBP) is catching a ride up the charts, pushing towards the front of the pack to come out in front as one of the winners on Friday, rebounding firmly against the Yen despite wavering in the mid-week after the Bank of England (BoE) held rates once more.
Economic data related to the GBP/JPY remains thin heading into next week, and GBP traders will be looking ahead to next Wednesday's appearance by BoE Governor Andrew Bailey, while Yen investors will want to keep an eye out for Japan's wage figures due early Tuesday, followed by JPY Trade Balance numbers on Wednesday.
GBP/JPY Technical Outlook
The GBP/JPY caught a bounce off an intraday rising trendline drawn from last week's bottoms near 180.80, and the pair is now trading into an 8-week high near the 150.0 major handle.
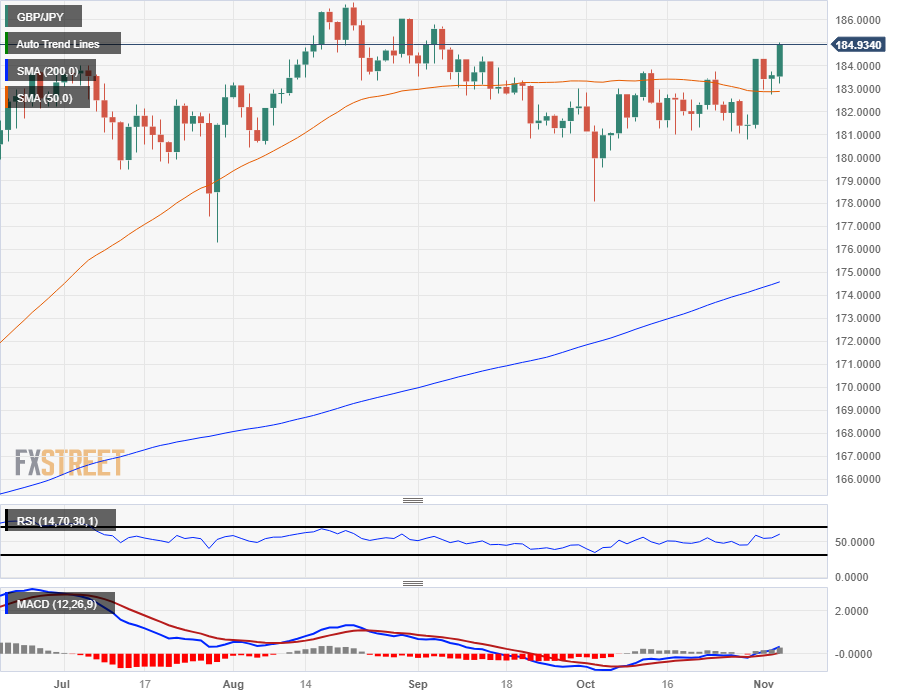
Daily candlesticks have the GBP/JPY trading back into the top side of the 50-day Simple Moving Average (SMA) which is currently grinding sideways near the 183.00 handle, and a bullish extension will see the Guppy set for a break of 2023's highs of 186.77.
Technical support is thin on the down side, but GBP/JPY sellers will be keeping a close eye on price action pulling back towards the last major swing low into the 178.00 level in early October.
GBP/JPY Hourly Chart

GBP/JPY Daily Chart

GBP/JPY Technical Levels