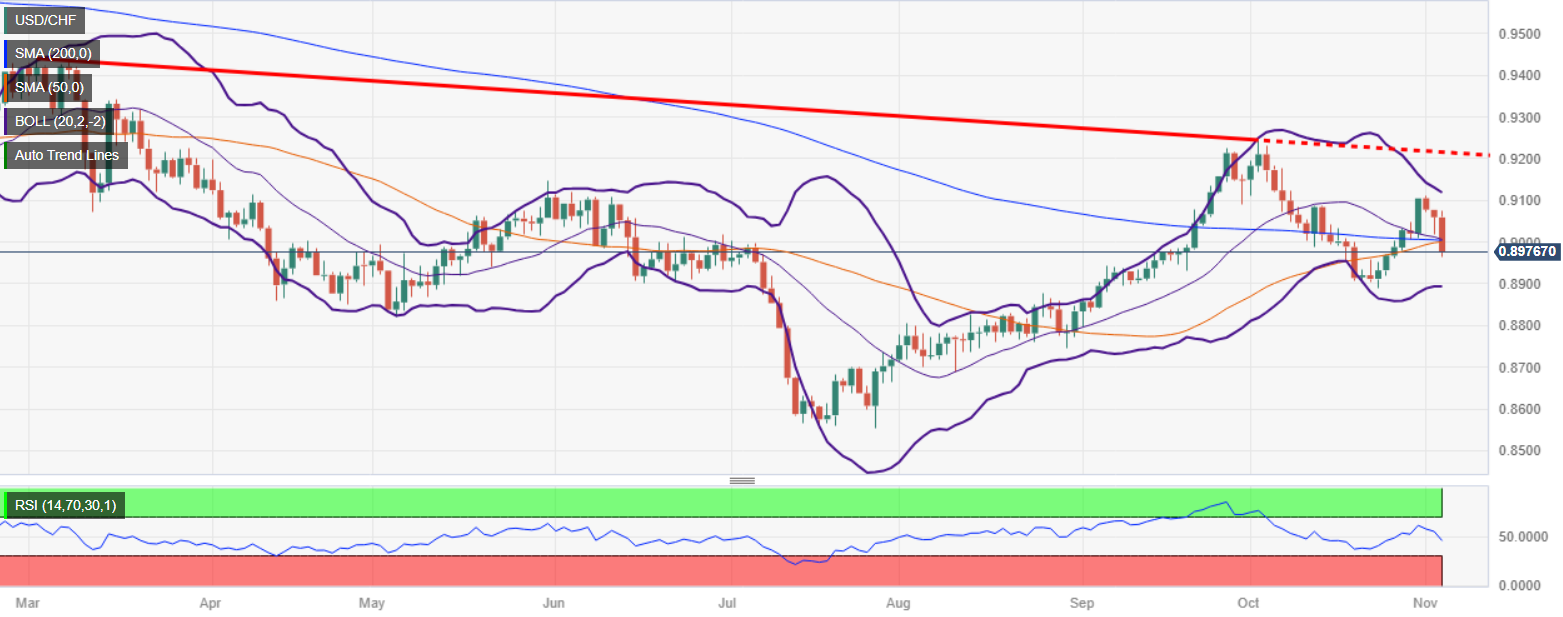
USD/CHF Price Analysis: Plummets below 0.9000, golden-cross at risk
- USD/CHF drops sharply, signaling potential end to Fed's rate hikes with investors favoring CHF.
- Pair's fall below the 50 and 200-day moving averages at 0.9000 could lead to further declines.
- For recovery, USD/CHF needs to breach 0.9000, targeting the November 1 high at 0.9112.
USD/CHF plummets in the mid-North American session on Friday after an employment report in the United States (US) could mark the end of the Federal Reserve (Fed) tightening cycle. Therefore, the US Dollar (USD) remains offered, as investors piled into the Swiss Franc (CHF), as shown by the pair trading at 0.8979, down 0.87%.
The daily chart shows the pair is slightly tilted to the downside despite remaining sideways, as USD/CHF has fallen below the confluence of the 50 and 200-day moving averages (DMAs) at around 0.9000. In the case of a daily close below the latter, the major could dive to the next swing low seen at 0.8878, the October 24 low, before plunging to the August 30 daily low of 0.8745.
On the flip side, USD/CHF buyers must reclaim the 0.9000 figure – the confluence of the 50 and 200-DMAs- so they could remain hopeful of challenging the November 1 high at 0.9112, ahead of challenging the May 31 high at 0.9147. Up next would be the 0.9200 psychological level.
USD/CHF Price Chart– Daily

USD/CHF Technical Levels