Gold Price Analysis: XAU/USD extends backslide, aimed for $1,950
- Spot Gold prices are seeing further losses on the week as risk appetite staggers.
- XAU/USD falls through $1,970, further downside on the cards.
- Market sentiment has reversed direction this week.
Spot Gold is getting knocked down for a second day in a row as the week rotates into risk-off flows following last week's sentiment recovery. Markets overwhelmingly heralded the end of rate hikes following last week's Federal Reserve (Fed) rate hold, but Monday saw a pullback as investors moderated their forward-looking positions on rate expectations.
Hawkish comments from Fed officials early Tuesday coupled with souring trade data from China is steepening a spike in risk aversion, adding to further red chart paper for Gold bids.
China trade balance figures came in below expectations, completely missing a forecast growth in headline trade data to show further contraction in China's goods exports. Fears of a global growth slowdown sparked by a faltering Chinese economy are once again drawing investor anxiety, cutting last week's risk rally short.
Fed's Kashkari: We have to let inflation and labor data guide us
Fed policymakers left the doors open for further Fed rate hikes in the future if inflation returns, and the US central bank is likely much further from enacting rate cuts than investors have been hoping for.
Fed member talking points continue to reinforce the "higher for longer" narrative, with several Fed policymakers noting that there will be no movement on rates until the data clearly implies it is time to do so.
XAU/USD Technical Outlook
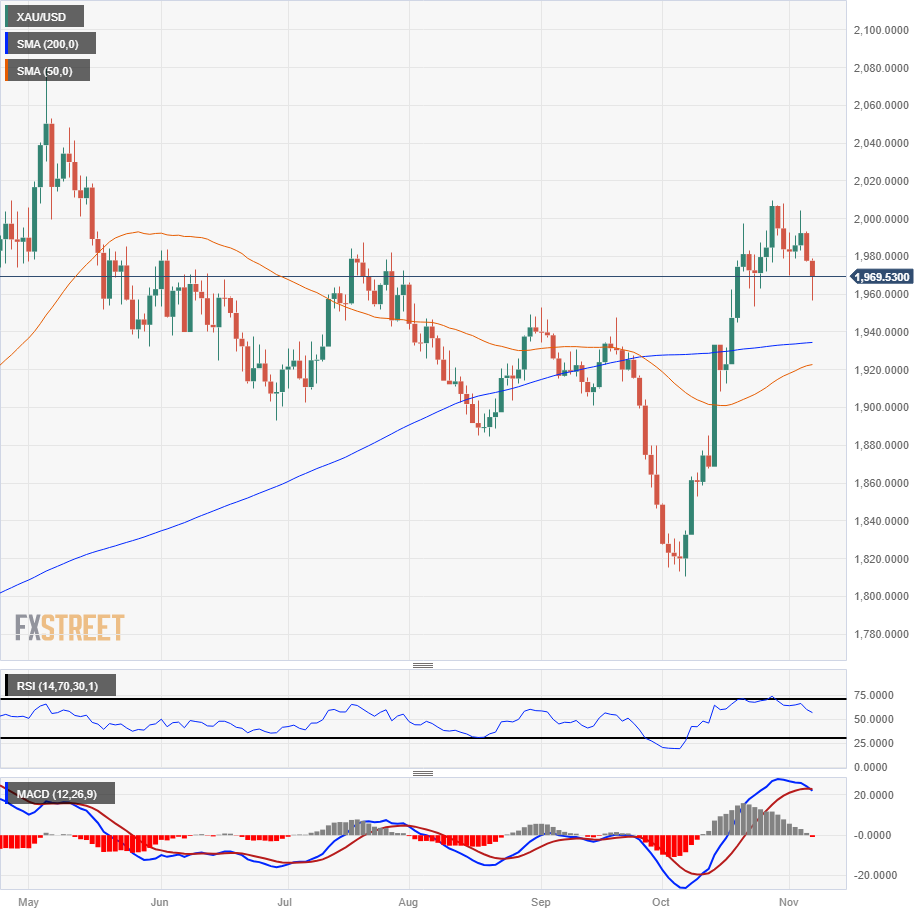
Spot Gold bids tumbled to $1,956.73 in Tuesday's risk-off slide, bringing the XAU/USD's two-day performance to -1.83%, and despite a recovery back towards the $1,970 region, Gold remains pinned in bear country for the time being.
XAU/USD is down 2% from the last swing high above the $2,000 major handle, but Spot Gold bids still remain above the 200-day Simple Moving Average (SMA) currently lifting into $1,940.
XAU/USD Daily Chart

XAU/USD Technical levels