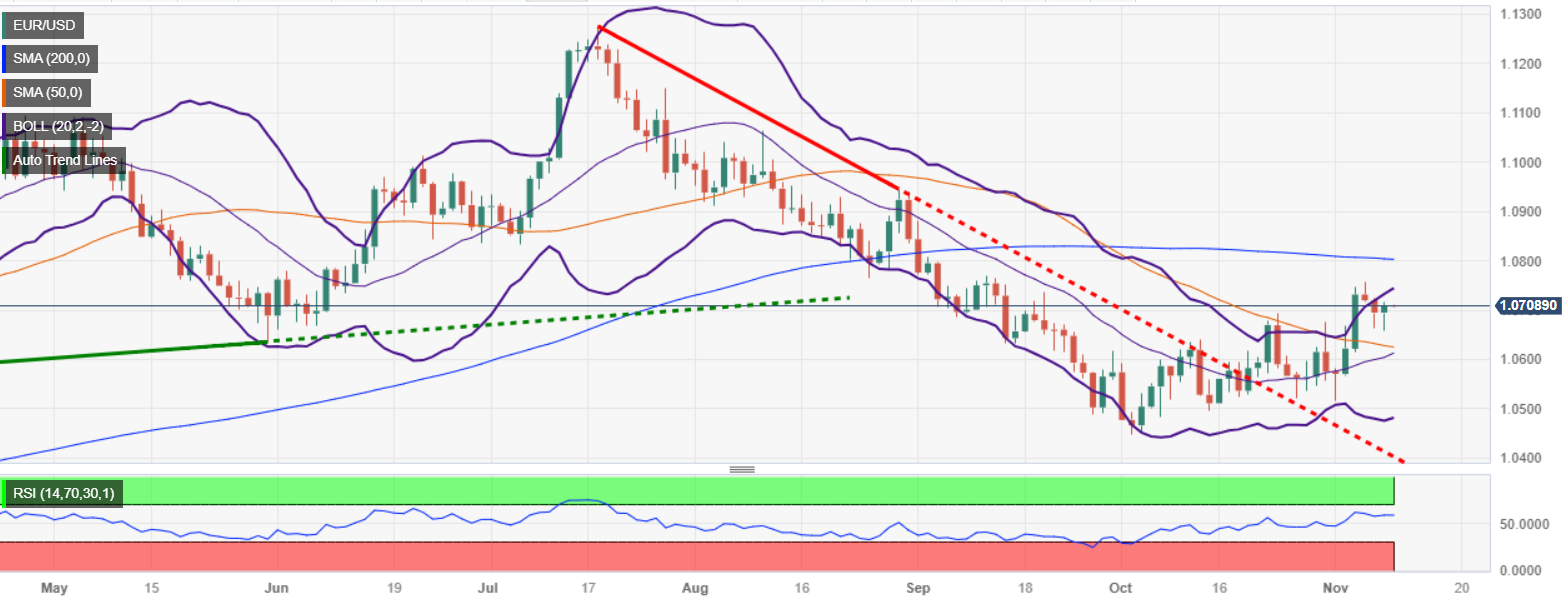
EUR/USD Price Analysis: Climbs back above 1.0700, prints minimal gains
- EUR/USD edges up to 1.0708, forming a bullish 'tweezers bottom' pattern, yet still below the crucial 200-day moving average at 1.0802.
- The currency pair maintains a neutral stance with a slight bullish tilt, trapped within a 'bearish flag' pattern on the daily chart.
- Resistance and support levels are set at 1.0758 and the 38.2% Fibonacci level at 1.0654, respectively, as the pair navigates through pivotal technical junctures.
EUR/USD turns positive late on Wednesday's North American session, but it remains shy of reclaiming the 200-day moving average (DMA) at 1.0802, seen as the next resistance level for buyers. The pair is trading at 1.0708, after forming a ‘tweezers bottom’ chart pattern, with bullish implications.
The daily chart portrays the pair is neutrally biased, though slightly tilted to the upside, but within the boundaries of a ‘bearish flag.’ On November 6, despite breaching the top of the flag, the EUR/USD finished the session offered, forming an inverted hammer, suggesting the EUR/USD could resume downwards. Even though the pair printed a three-day low of 1.0659, it failed to breach support at the 38.2% Fibonacci level of the Fibonacci retracement drawn from the November 1 low to the November 6 swing high, keeping buyers hopeful of higher prices.
Key resistance levels lie at 1.0758, November’s 6 high, followed by the 200-DMA at 1.0802. On the flip side, the first support is seen at the 38.2% Fibonacci level at 10.654, followed by the confluence of the 50-DMA and the 50% Fibo retracement at 1.0624/35.
EUR/USD Price Analysis – Daily Chart

EUR/USD Technical Levels