USD/SEK declines as US yields lose traction
- The USD/SEK trimmed daily gains and declined towards 10.900, seeing mild losses.
- The US government bond yields are falling.
- Fed expectations and the bond markets will dictate the pace of the session.
The USD/SEK initially rose to a high of 10.9790 on Wednesday and then stabilised around the 10.900 area, with the trajectory of the pair being set by falling US bond yields, which limited the pair’s upside. Other than that, there were no relevant highlights during the session, and the focus is set on next week’s inflation figures from the US from October.
As the economic calendar had nothing relevant to offer on Wednesday, markets seem to be awaiting fresh stimulus to place their next positions. At the beginning of the week, several Federal Reserve (Fed) were seen pushing back on the dovish narrative, which eventually favoured the rise of the US Dollar and the Treasury yields. Still, investors seem to be awaiting high-tier data, as those will shape the bank's decision next December.
Next week, the US will release Consumer Price Index (CPI) figures from October, which are expected to show a slight deceleration. In that case, markets would likely take of the table the case of a hike in December, which would fuel downward movements on the back of a weakening US Dollar.
In the meantime, the US Treasury 5 and 10-year bond yields are sharply declining, falling towards 4.51%. The 2-year rate stands flat at 4.90%.
USD/SEK Levels to watch
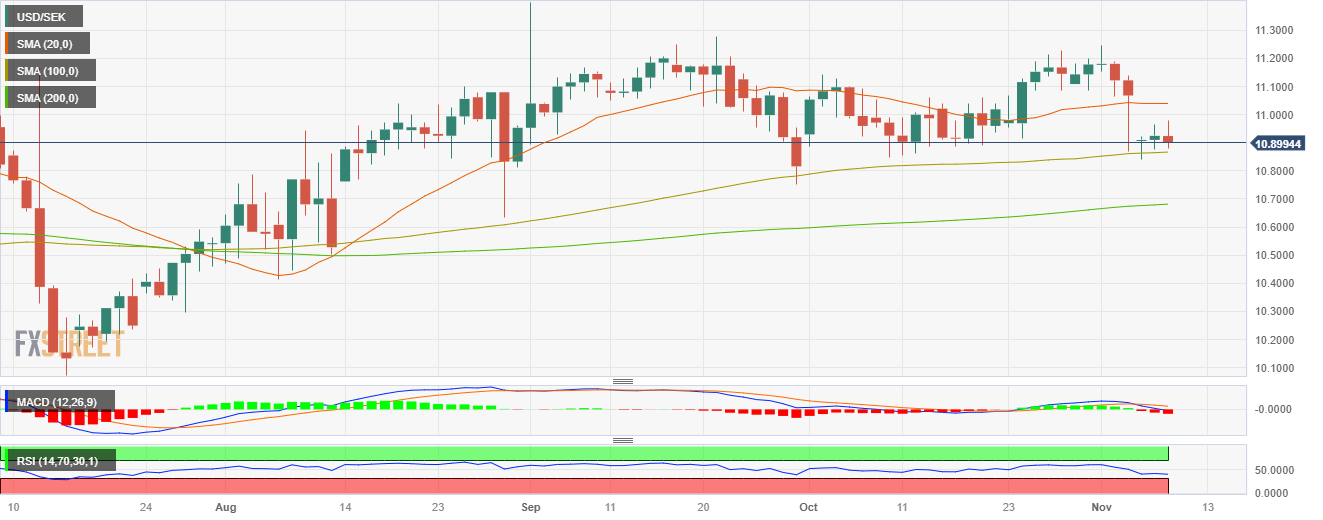
According to the daily chart, the technical outlook for the USD/SEK remains neutral to bearish as the bears are showing signs of recovery. With a flat slope below its midline, the Relative Strength Index (RSI) suggests a period of stability in negative territory, while the Moving Average Convergence (MACD) displays neutral red bars.
On a broader scale, the pair is below the 20-day Simple Moving Average (SMA) but above the 100 and 200-day SMAs, highlighting the continued dominance of bulls. That being said, in case of not recover the 20-day SMA, the pair may see further downside.
Supports: 10.857 (100-day SMA), 10.830, 10.800.
Resistances: 10.9050, 10.950, 11.020 (20-day SMA).
USD/SEK Daily chart
