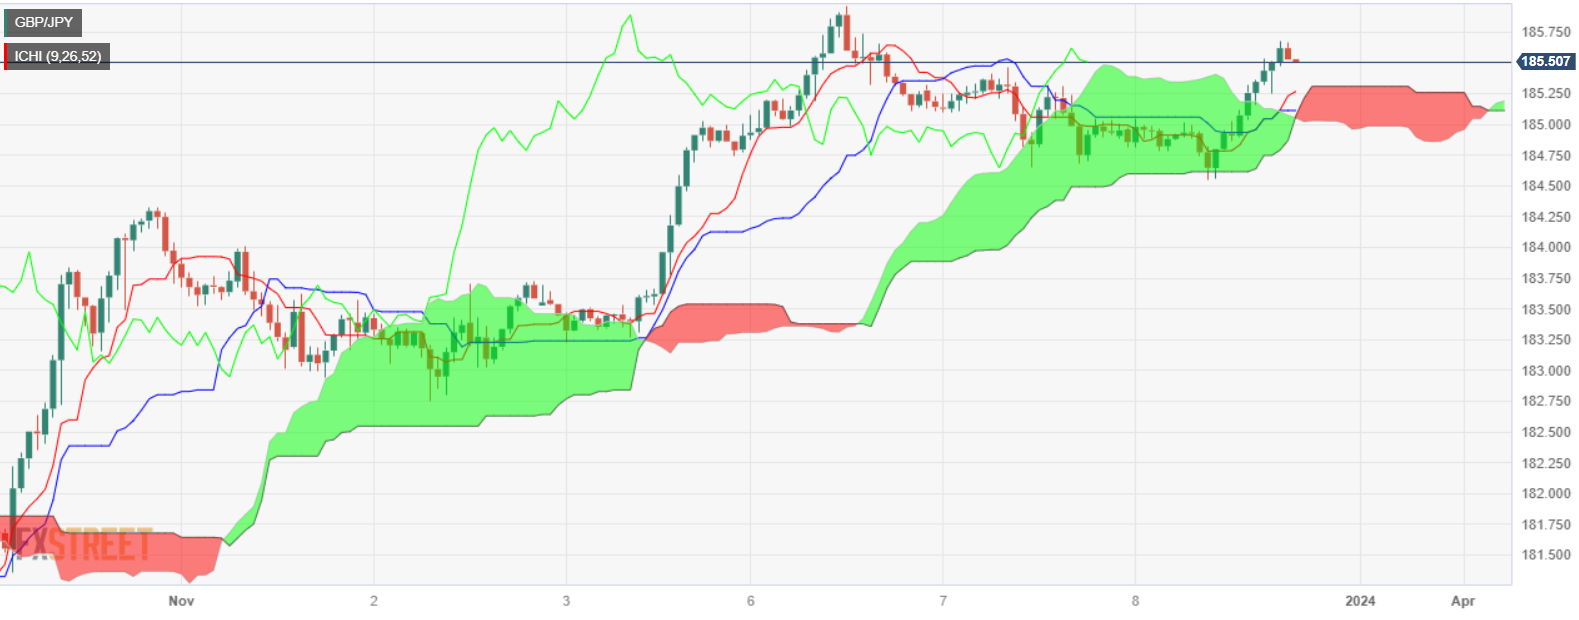
GBP/JPY Price Analysis: Climbs above 185.50 as rising wedge looms
- GBP/JPY breaks above Tuesday’s high as the uptrend gathers steam.
- On the upside, key resistance levels lie at 186.00 and the YTD high.
- If the cross-pair drops below 184.70, downside risks emerge below 184.00.
The GBP/JPY reverses its course after posting decent losses of 0.20% on Tuesday and has risen past yesterday’s high of 185.46, as buyers target the current week’s high of 185.95. At the time of writing, the cross-pair is trading at 185.57 for a gain of 0.22%.
Even though the uptrend remains intact, price action seems overextended, though, in the short term, GBP/JPY buyers could challenge the 186.00 figure, ahead of testing the year-to-date (YTD) high of 186.77. Nevertheless, it should be said the Ichimoku Cloud (Kumo) is horizontal, indicating the uptrend might be losing steam.
In that scenario, if GBP/JPY dives below the November 6 low of 184.68, the next support would be the 184.00 mark. Once cleared, the Tenkan-Sen would be up next at 183.36, followed by the Kijun-Sen at 182.76.
GBP/JPY Price Chart – Daily

GBP/JPY Technical Levels