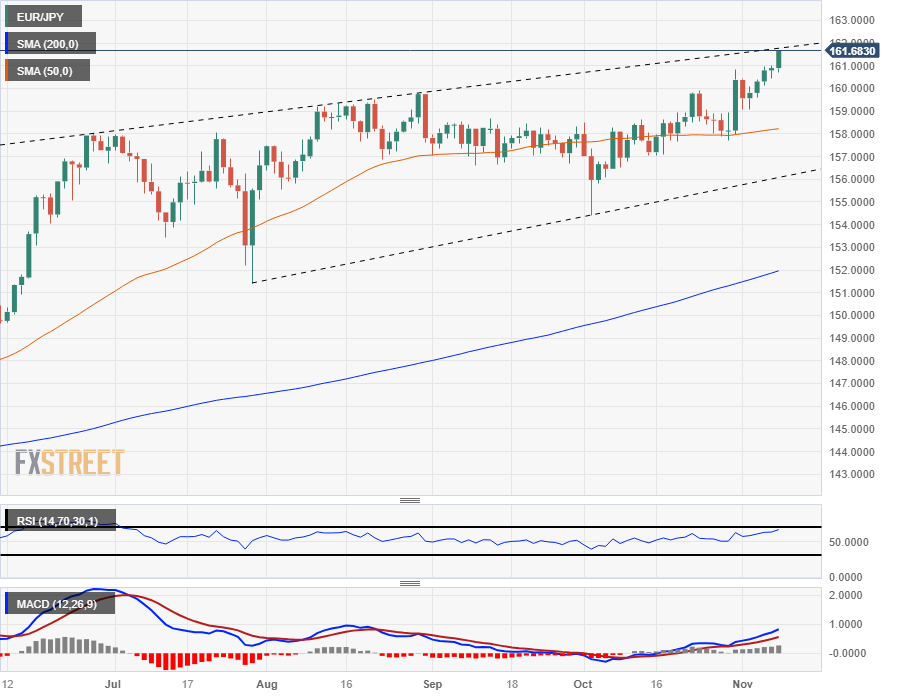
EUR/JPY continues to march higher, claims 15-year highs above 161.50
- The EUR/JPY continues to climb, tipping into a 15-year high.
- The Yen is fumbling across the board for Wednesday.
- Investors likely to begin watching for signs of intervention from the BoJ.
The EUR/JPY is edging into its highest bids in over 15 years, trading north of 161.50 and looking for more. The Japanese Yen (JPY) has struggled recently, being all but abandoned by a hyper-dovish Bank of Japan that remains entirely focused on propping up long-run growth expectations for the Japanese economy even as the Yen continues to tumble to record lows.
The BoJ remains firmly dedicated to their hyper-easy monetary policy framework, leaving the Yen little place else to go but to drain down the charts, and the Eur (EUR) is seeing a upshot breakaway.
With the JPY trading so poorly against other assets, it's only a matter of time before someone at the BoJ decides enough is enough and begins to intervene in currency markets in a bid to protect their domestic currency from further selling.
The early Thursday Asia market session sees trade balance figures for Japan, with the headline non-seasonally-adjusted Current Account for September expected to rise from JPY 2.2 trillion to 3 trillion.
EUR/JPY Technical Outlook
The Euro is up over 2.5% against the Yen from last week's swing low into 157.70, and with little technical patterns on the high end to cap bullish momentum, the pair could see an easy break into further record territory.
The EUR/JPY caught a clean bounce from the 50-day Simple Moving Average (SMA) last week, and long-term chart support sits at the 152.00 handle with the 200-day SMA.
A rising trendline from late July's swing low into 152.00 is also pricing in a technical floor from the 156.00 region.
EUR/JPY Daily Chart

EUR/JPY Technical Levels