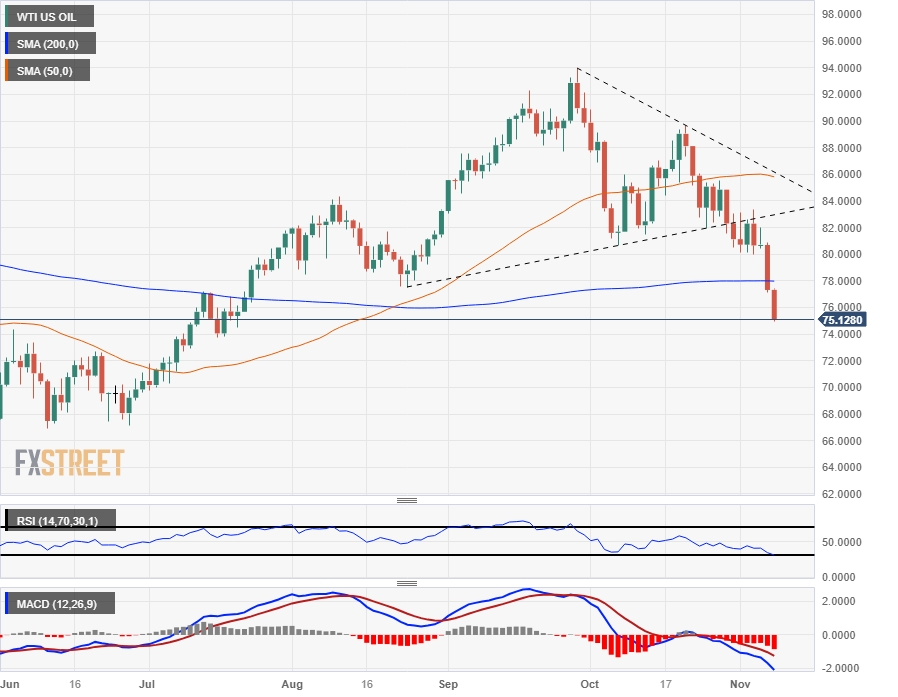
Crude Oil falling back, WTI hits $75
- Crude Oil is extending the week's declines as demand for barrels swoons.
- US Crude stocks soared on Tuesday, and China's data slowdown is hinting at slowing Crude demand.
- Looming risk of Crude Oil undersupply is completely overshadowing geopolitical concerns.
West Texas Intermediate (WTI) Crude Oil barrels are getting knocked back heading into the mid-week, testing the $75.00/barrel region as the narrative of global Crude Oil undersupply runs up against hard data suggesting the recent slump in barrel availability is to have much less impact than initially expected.
US Crude Oil stocks soared by almost 12 million barrels last week according to numbers from the American Petroleum Institute (API). By the API's count, 11.9 million barrels showed up in the US Crude Oil supply stream for the week into November 2nd, a significant jump over the previous week's 1.347 million barrel building.
Adding to Crude Oil woes, Chinese economic data continues to disappoint, dousing fears that China's future Crude Oil demand would suck global markets dry.
China's Trade Balance figures sharply missed the mark on Tuesday, declining to $56.53 billion in October compared to the previous month's $77.71 billion as consumption spending in China sharply contracts.
WTI Technical Outlook
WTI's Wednesday decline sees Crude Oil extending a bearish slide after smashing through the 200-day Simple Moving Average (SMA) near $78.00, making a clean break and heading straight into bear country at the $75.00 handle.
Crude Oil is down over 20% from late September's swing high that just missed the $94.00 handle, and WTI's tumble from the low side of a rising trending from $78.00 sees bearish momentum set to expand heading into the back half of the trading week.
WTI Daily Chart

WTI Technical Levels