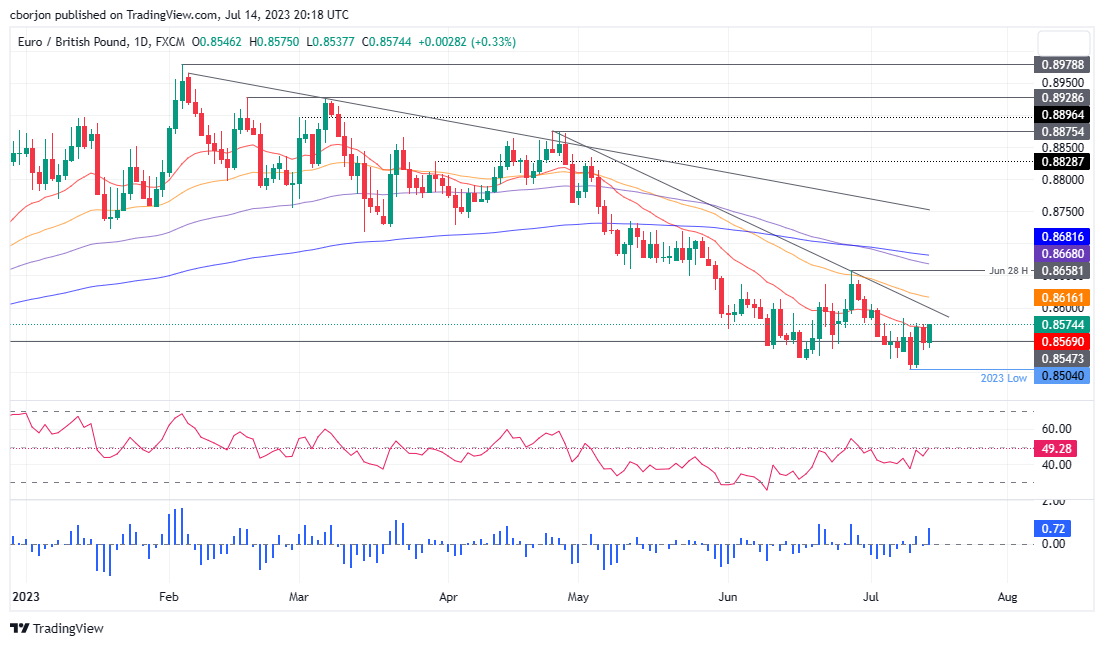
EUR/GBP eyes bullish turn: A breach of 08600 could spark uptrend
- EUR/GBP consolidates within a tilted downward bias, with key support at 0.8504.
- The pair’s bullish turn hinges on a 0.8600 breach, testing 50-day EMA.
- RSI is nearing bullish zone; RoC indicates a potential uptrend.
EUR/GBP reverses Thursday’s losses and is set to print weekly gains of 0.40% after Pound Sterling (GBP) bulls emerged yesterday, trimming some of its Wednesday losses. Nevertheless, selling pressure waned, and the EUR/GBP sits above a technical support level. At the time of writing, the EUR/GBP exchanges hands at 0.8573, up 0.32%.
EUR/GBP Price Analysis: Technical outlook
The EUR/GBP daily chart portrays the pair in consolidation, with a downward bias, which could extend if sellers drag prices past the year-to-date (YTD) low of 0.8504. In that event, the next support would be the 0.8450 psychological level before the EUR/GBP dives towards the August 24 swing low of 0.8408.
Conversely, the EUR/GBP could threaten to turn bullish, above the 50-day Exponential Moving Average (EMA) at 0.8616, which would be tested once the Eur/GBP passes the 0.8600 mark. A breach of the latter will expose the June 28 swing high at 0.8658, ahead of the 100-day EMA a 0.8668, followed by the 200-day EMA at 0.8681.
Oscillator-wise, the Relative Strength Index (RSI) is at the brisk of turning bullish, which could exacerbate the EUR bulls’ reaction. The three-day Rate of Change (RoC) portrays the cross as having an upward biased.
Hence, the EUR/GBP could be ready for a bullish resumption in the near term.
EUR/GBP Price Action
