NZD/JPY clears daily gains as bullish momentum wanes
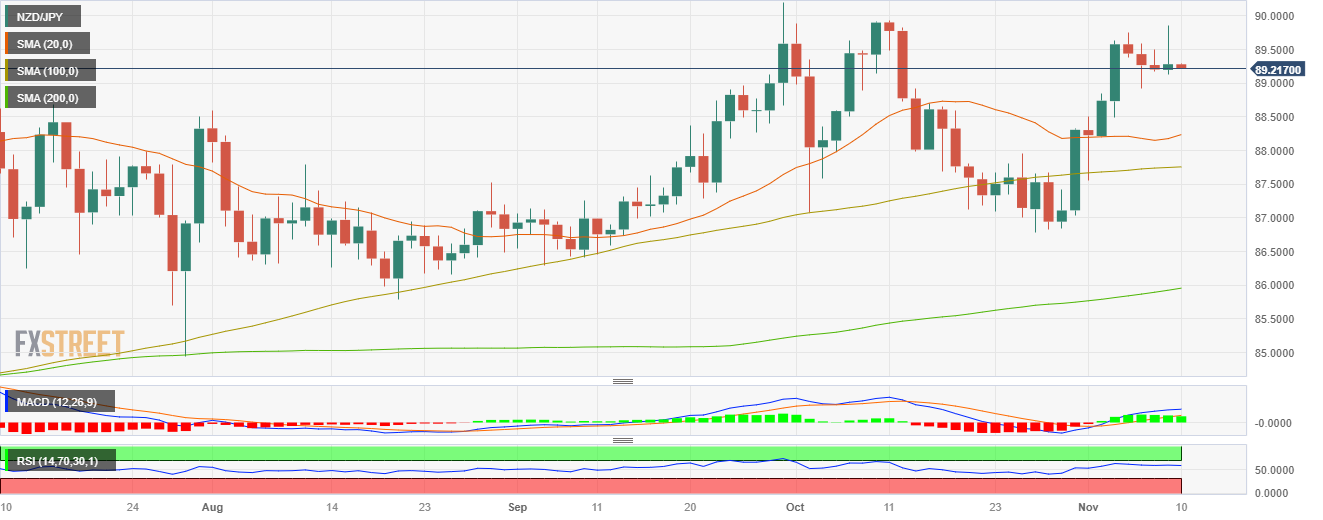
- NZD/JPY met resistance at a daily high of around 89.863 and then declined towards 89.245.
- Indicators turned flat in positive territory on the daily chart.
- The cross is still bullish in the long term as it trades above the 20, 100 and 200-day SMAs.
The NZD/JPY failed to hold its momentum, which took the cross to a multi-week high of around 89.865 and then closed at around 89.200.
The technical analysis of the daily chart suggests a shift towards a neutral to a bearish outlook for NZD/USD, with indicators flashing signs of bullish exhaustion. The Relative Strength Index (RSI) maintains a flat slope above 50, while the Moving Average Convergence (MACD) presents lower green bars. On the four-hour chart, the bearish momentum is more evident, with the RSI and MACD plunging into the negative zone.
That said, the pair is above the 20,100,200-day Simple Moving Average (SMA), indicating a favourable position for the bulls in the bigger picture. In addition, the 100-day SMA seems to be converging towards the 20-day average to perform a bullish cross in the 88.150-88.300 area, which could reignite the momentum for the buyers in the short term.
Support levels: 89.000, 88.700,88.500.
Resistance levels: 89.500, 89.850, 90.000.
NZD/USD Daily Chart
