WTI remains stuck on the low end as US Crude Oil production hits all-time high
- Crude Oil saw a minor relief bid on Thursday before getting pushed back down.
- WTI ticked into $77.00 before slipping back to $75.00.
- US hits all-time highs on Crude Oil production.
West Texas Intermediate (WTI) Crude Oil continues to get pushed into recent lows as barrel bids struggle to find the floor on bearish price pressures.
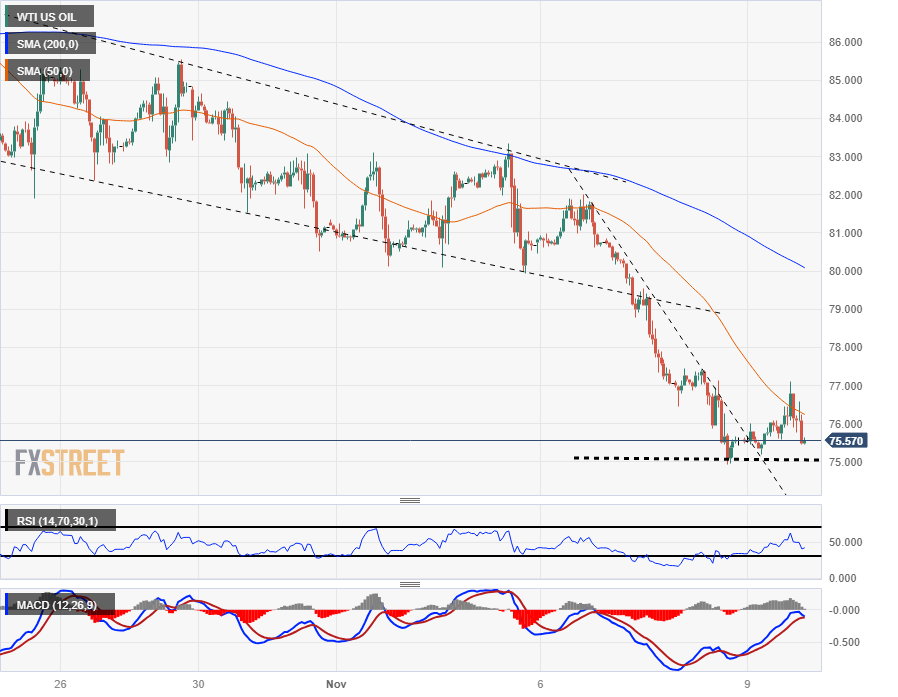
WTI climbed Thursday, recovering the $77.00 handle before getting pushed back down towards $75.00 in the back half of the trading day.
the overarching market narrative of chronic undersupply that has been shooting through energy markets are running up against a hard barrier as reality sets into Crude Oil markets; despite strategic, long-running cuts from oil-producing nations, expectations of global undersupply are failing to materialize.
A lack of a surge in Crude Oil demand is certainly helping things as China's economy recovery continues to falter and oil demand remains much more tepid than most investors expected, but the US also hit an important milestone this week.
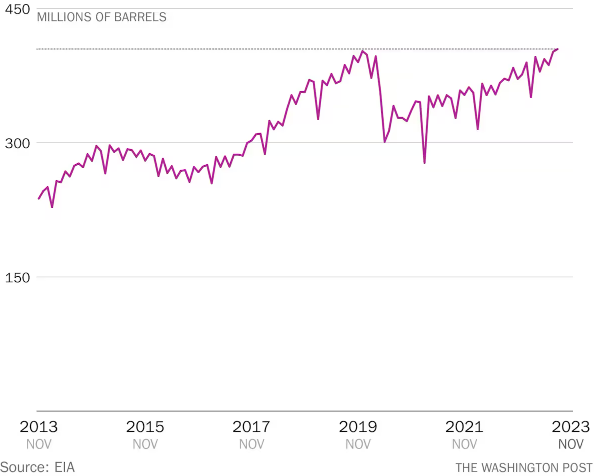
US Crude Oil production hit an all-time high in reporting figures, with the US pumping over 404 million barrels of oil through August according to data from the Energy Information Administration (EIA). This broke the US' previous barrel production record of 402 million barrels produced in December of 2019.
Monthly Crude Oil production in the US

WTI Technical Outlook
With Crude Oil falling back from the 50-hour Simple Moving Average (SMA) on the intraday charts, there's a real risk of a bearish extension if short sellers can push WTI back below the $75.00 handle.
WTI chart losses are accelerating away from the median, accelerating short momentum as price action drops away from the 200-hour SMA currently dropping into the $80.00 region.
WTI bids saw a rejection from the 200-day SMA last Friday, and technical resistance barriers are piling up in the near term, creating friction for any Crude Oil bidders looking to step into the markets.
WTI Hourly Chart

WTI Technical Levels