NZD/JPY advances slightly but closes a losing week
- NZD/JPY rose nearly 0.10% towards the 89.245 area
- The cross continues to side-ways trades, slightly tilted to the downside.
- Bulls seem to be taking a breather after last week’s 3% gains.
The NZD/JPY will close a 0.30% losing week around the 89.245 area, as investors are taking profits from the early month's sharp gains.
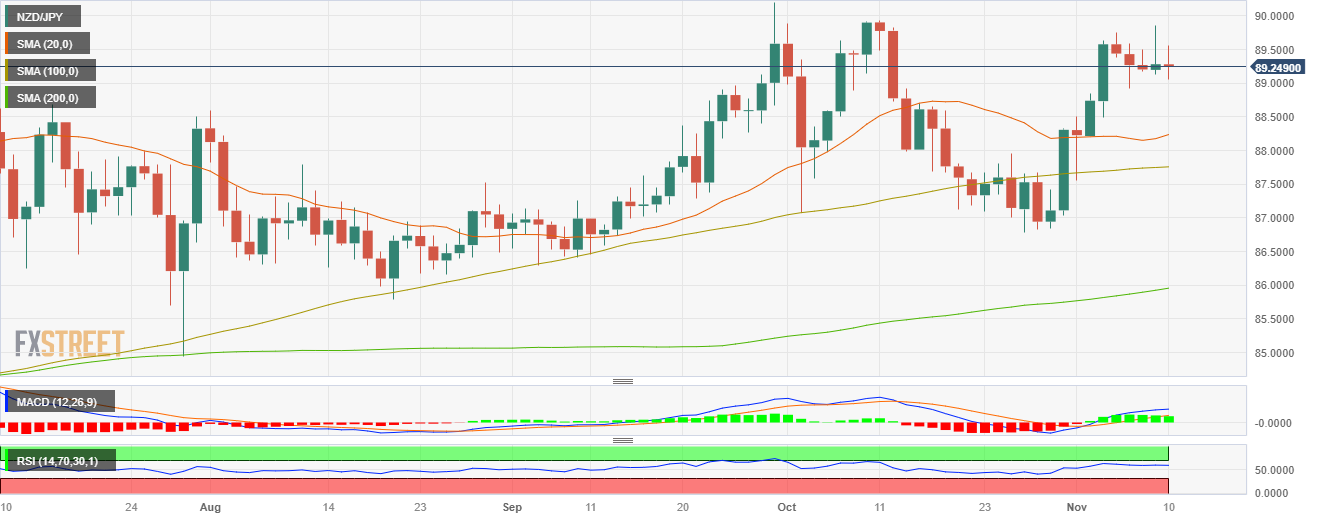
Observing the daily chart, the NZD/JPY displays signs of bullish exhaustion after the cross gained more than 3% at the beginning of November. The Relative Strength Index (RSI) has turned flat above its midline, while the Moving Average Convergence (MACD) prints neutral green bars. On the four-hour chart, the indicators have also flattened but are also slightly lilted to the upside, suggesting that buyers are consolidating gains.
Additionally, the cross is above the 20,100,200-day Simple Moving Average (SMA), suggesting that the outlook also favours the bulls in the larger time frames. Furthermore, there could be a bullish confirmation as the 100-day SMA is converging towards the 20-day average to perform a bullish cross, which could reignite the momentum for the buyers in the short term.
Support levels: 89.000, 88.700, 88.500.
Resistance levels: 89.5000, 89.850,90.000.
NZD/JPY Daily Chart
