USD/SEK declines as the US Dollar consolidates gains
- The USD/SEK is seen at 10.908 with 0.10% loses
- US Treasury yields retreated after sharply rising on Thursday.
- All eyes are on next week's CPI data from October from the US.
The USD/SEK showed minimal downward movements around the 10.908 area on Friday. The pair declined as the Greenback consolidated the week’s gains while falling US yields and negative consumer sentiment data from the University of Michigan are making the US Dollar struggle to gain interest.
On the data front, the University of Michigan revealed that its Consumer Sentiment index from November came in lower than expected at 60.4 vs the consensus of 63.7 and fell from its previous reading of 63.8. That being said, no other high-tier reports were published during the week as the focus is set on next week’s Consumer Price Index (CPI) figures from the US from October, which are expected to show a slight deceleration.
It's worth noticing that the Federal Reserve (Fed) hawks and Chair Powell claimed during the week that they left the door open for further tightening so the outcome of inflation or labor market data may shape the expectations of the next decisions of the bank. As for now, the odds of a 25 bps hike for the December meeting are low, around 10%.
Elsewhere, the Fed’s hawkish rhetoric revived US yields, and the 2-year Treasury yield rose back to 5%, while the 5 and 10-year rates increased to 4.59% and 4.60%, which allowed the USD to gain interest, pushing the pair upwards.
USD/SEK Levels to watch
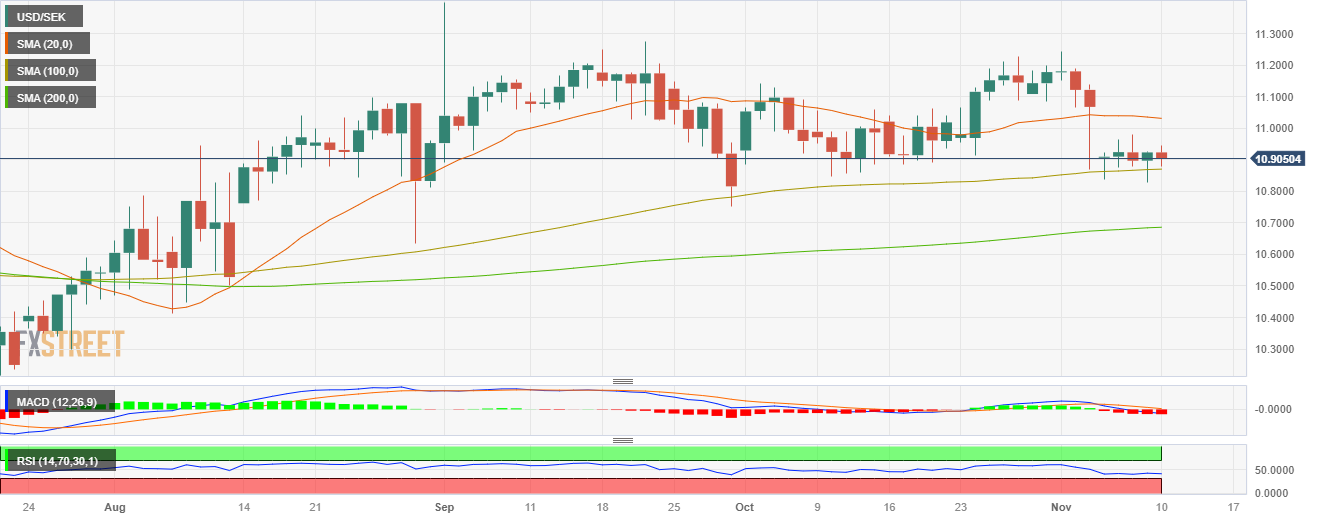
According to the daily chart, the technical outlook for the USD/SEK remains neutral to bearish as the bears are raking a breather after bringing down the pair by more than 2%. The Relative Strength Index (RSI) has turned flat below its midline, while the Moving Average Convergence (MACD) prints flat red bars.
In the larger context, the pair is below the 20-day Simple Moving Average (SMA) but above the 100 and 200-day SMAs, indicating a favourable position for the bulls in the bigger picture.
Supports: 10.861 (100-day SMA), 10.822, 10.811.
Resistances: 10.950, 10.973, 11.000 (20-day SMA).
USD/SEK Daily chart
