NZD/JPY remains steady near 89.15 as bulls extend consolidation
- The NZD/JPY is seen at 89.15 with 0.15% losses.
- Bulls continue to be on the sidelines after November’s strong start.
- Indicators suggest that the bears are gaining momentum.
The NZD/JPY saw little downward movements on Monday near the 89.15 area as bulls continued consolidating a solid start of the month.
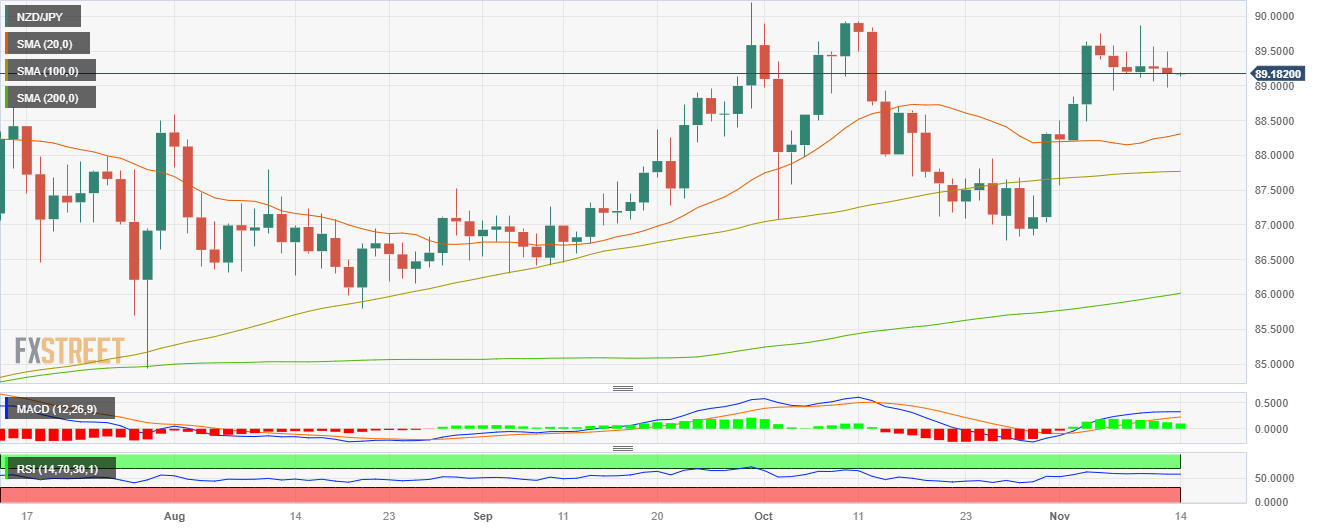
In that sense, according to the daily chart, the NZD/JPY has a neutral to bearish technical outlook, with indicators signalling a short-term pause in the bulls' upward movement as they consolidate after winning more than 3% at the beginning of November. The Relative Strength Index (RSI) exhibits a negative slope above its midline, while the Moving Average Convergence (MACD) presents lower green bars. In the broader context, despite showing a negative outlook in the short-term, the pair is above the 20,100,200-day Simple Moving Average (SMA), suggesting that the bulls are firmly in control of the overall trend.
Zooming in, the four-hour chart shows that the bearish presence is more evident, with the RSI and MACD standing in negative territory. In that sense, the sellers may continue gaining ground as long as the bulls remain asleep.
Support levels: 89.00, 88.75, 88.30 (100-day SMA).
Resistance levels: 89.30 (20-day SMA), 89.50, 90.00.
NZD/JPY daily chart
