NZD/JPY retreats from multi-year highs, further consolidation incoming
- The NZD/JPY declined to 90.00, seeing 1.20% losses and clearing most of Wednesday’s losses.
- Investors are taking profits after hitting highs since 2015.
- Indicators still suggest that the bulls are in command, but in the short-term, it could correct further.
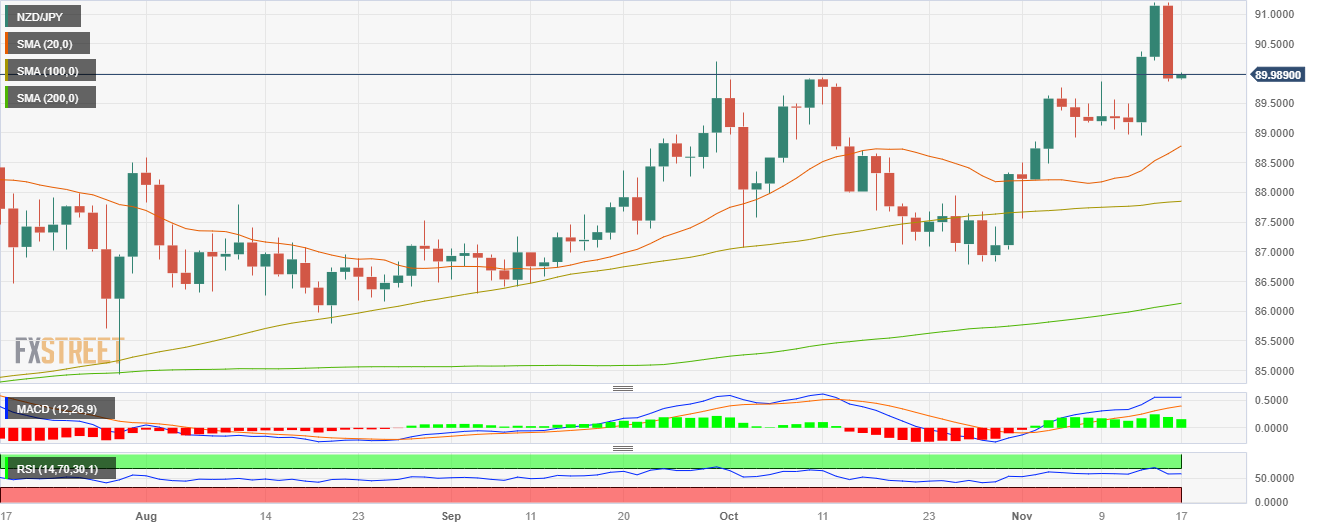
The NZD/JPY sharply declined in Thursday’s session, seeing more than 1% losses and trimming all of Wednesday’s gains as the cross consolidated the rally which took it to a multi-year high of 91.20.
In that sense, according to the daily chart, the NZD/JPY has a neutral to bullish technical outlook, with indicators signalling a short-term pause in the bulls' upward after hitting overbought conditions and the Relative Strength Index (RSI) exhibits a negative slope still above its midline, while the Moving Average Convergence (MACD) presents lower green bars. In line with that, the cross trades above the 20,100,200-day Simple Moving Average (SMAs) suggest that the bulls are in command over the sellers in the larger context.
In the four-hour chart, indicators are tilting in favour of the bears, with the RSI and MACD standing in negative territory, suggesting that the cross may face further consolidation in the near term.
Support levels: 89.25, 89.00, 88.60 (20-day SMA).
Resistance levels: 90.00, 90.30, 91.20.
NZD/JPY daily chart
