EUR/GBP Price Analysis: Bulls remain in control in broader context, bears loom
- EUR/GBP gravitates around 0.8700, seeing losses of 0.15%.
- The daily chart signals a bearish bias, while the four-hour chart indicators imply a temporary selling momentum pause.
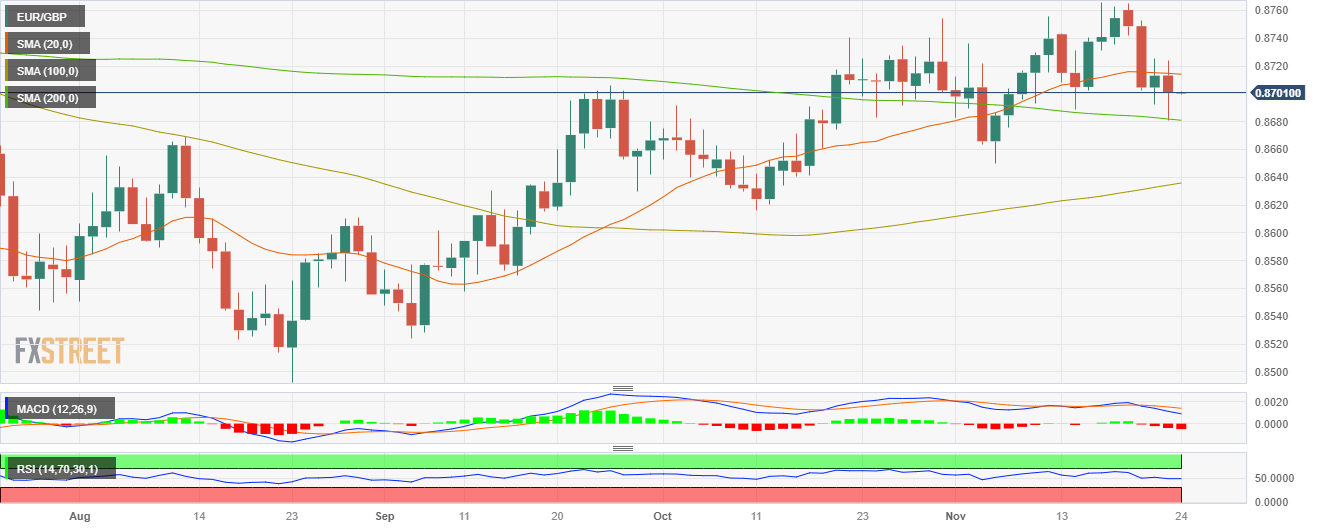
On Thursday's session, the EUR/GBP was found to be declining towards 0.8700, seeing 0.15% losses. On the daily chart, sellers are firmly in charge, with the bears steadily gaining ground. However, according to the four-hour chart, selling momentum appears to have slowed down, suggesting that the bulls may step in time.
The downward trend of the Relative Strength Index (RSI) in negative territory raises a red flag, suggesting a strengthening bearish momentum as well as the rising red bars of the Moving Average Convergence Divergence (MACD). Simultaneously, the pair is trading in a limbo state between the Simple Moving Averages (SMAs). It resides under the 20-day SMA, indicating bearish pressure in the short run, while lofting above the 100 and 200-day SMAs, pointing to a bullish bias on a broader scope. This split profile insinuates that although bears have gained ground, the bulls remain dominant in the overall trend.
Zooming in, the four-hour chart’s RSI is flatlining in negative territory, hinting at the exhaustion of selling pressure. Furthermore, the MACD accentuates this impression by displaying flat red bars, indicating limited bearish momentum.
Support Levels: 0.8680 (200-day SMA), 0.8650, 0.8600.
Resistance Levels: 0.8715 (20-day SMA), 0.8750, 0.8800.
EUR/GBP daily chart
