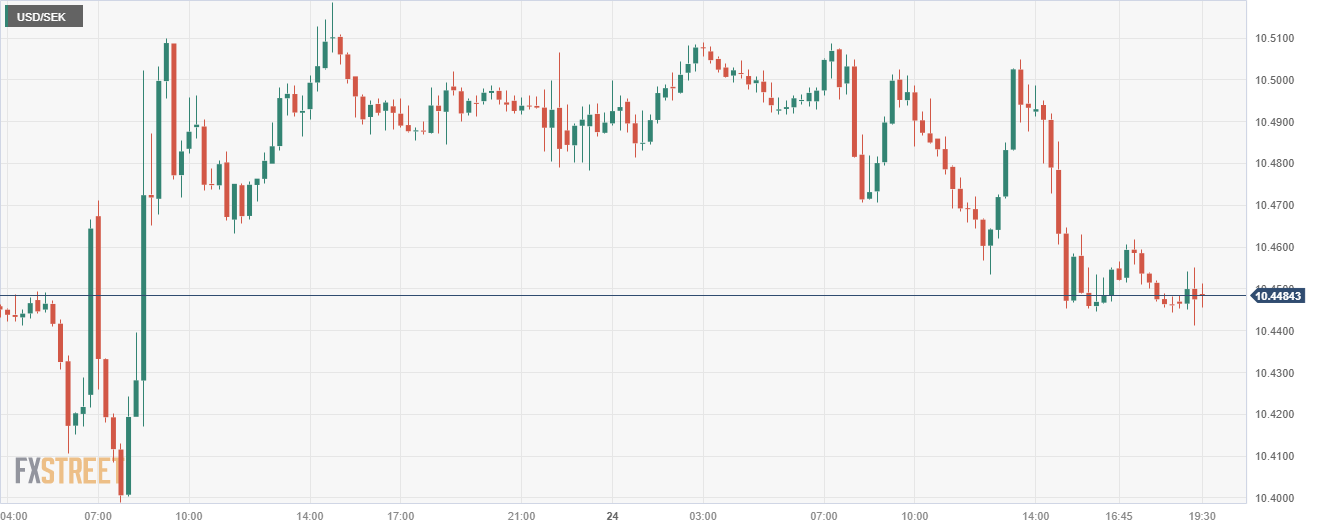
USD/SEK declines further after mixed US S&P PMIs and hawkish Riksbank hold
- The USD/SEK pair witnessed a 0.30% drop, hovering around the 10.452 level.
- Mixed S&P PMIs make the US struggle to gather demand.
- Riksbank's hawkish hold on Thursday strengthened the SEK as the bank didn’t rule out a hike in 2024.
The Swedish Krona (SEK) is gaining ground against the US Dollar (USD) in Friday's trading session, with the pair trading near the 10.452 region seeing 0.30% losses. The pair’s movements were driven by mixed US S&P PMI data and a hawkish hold from the Riksbank.
In line with that, the Riksbank kept the policy rate unchanged at 4% in November but has indicated the possibility of raising it at the beginning of 2024. The bank also noted that "inflation has fallen and inflationary pressures have clearly eased", but it left the door open for further hikes in case data justifies it, a similar position taken by the Federal Reserve (Fed).
On the USD side, the US private sector experienced marginal growth, as reflected by the steady S&P Global Composite PMI at 50.7. While the Manufacturing PMI slightly dipped into contraction at 49.4, the Services PMI witnessed a small rise to 50.8. The negative highlight was that it was recorded as the first employment decrease in US service and manufacturing sector, and this outlook weakened the US Dollar.
Regarding the Fed expectations, markets are confident that the bank will not hike in December and are already betting on four rate cuts in 2024, starting in May. That being said, the incoming data will determine the bank’s easing calendar as it still remains data-dependent.
USD/SEK levels to watch
On the daily chart, indicators indicate that a consolidation may be incoming as the Relative Strength Index (RSI) is flat in oversold territory. Normally, this would suggest an impending price rebound as it hints that selling momentum weakens, further supported by the Moving Average Convergence Divergence (MACD), which displays flat red bars.
Additionally, the pair is currently positioned below the 20,100 and 200-day Simple Moving Averages (SMAs), pointing to short and long-term bearish pressures and an overall selling dominance.
Support Levels: 10.350, 10.200, 10.150.
Resistance Levels: 10.520, 10.600, 10.670 (200-day SMA).
USD/SEK daily chart
