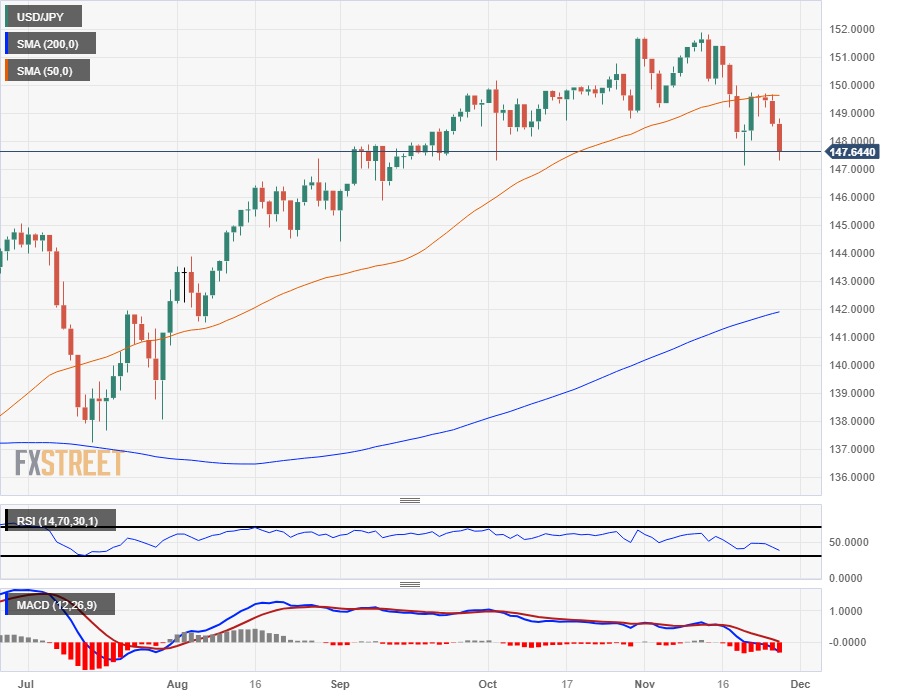
USD/JPY dips below 147.40 as Greenback gets punched lower by broad-market risk bid
- The USD/JPY is down after shedding a full percent peak-to-trough from Tuesday's high bids.
- The US Dollar accelerated losses as broader markets flip the switch on risk appetite.
- The USD/JPY is testing into last week's lows just above the 147.00 handle.
The US Dollar (USD) is seeing broad-market declines on Tuesday as market sentiment lurches higher. The Greenback is down a full percentage point from Tuesday's peak bids near 148.80 against the Japanese Yen (JPY), shedding half a percent from the day's opening prices at 148.10.
The Greenback's Tuesday backslide is being fueled by unexpectedly dovish comments from Federal Reserve (Fed) Governor Christopher Wallace, who insisted in public comments that he sees no reason to continue holding interest rates at high levels if inflation continues to decline.
Fed’s Waller: If inflation constantly declines, there is no reason to insist in really high rates
The dovish Fed appearance helped spark a decline in the US Dollar Index (DXY), shrugging off an equally hawkish statement from Fed Governor Michelle Bowman who declared she is just as willing to support further rate hikes if inflation continues to overshoot Fed targets.
Fed’s Bowman: I remain willing to support rate hikes if progress on inflation stalls
The mid-week's focal point will be a US quarterly Gross Domestic Product (GDP) growth print, and markets are expecting a slight uptick in QoQ US GDP growth from 4.9% to 5%.
Japanese Yen price today
The table below shows the percentage change of Japanese Yen (JPY) against listed major currencies today. Japanese Yen was the strongest against the US Dollar.
| USD | EUR | GBP | CAD | AUD | JPY | NZD | CHF | |
| USD | -0.14% | -0.33% | -0.18% | -0.33% | -0.51% | -0.30% | -0.19% | |
| EUR | 0.14% | -0.17% | -0.01% | -0.16% | -0.35% | -0.13% | -0.04% | |
| GBP | 0.33% | 0.17% | 0.17% | 0.01% | -0.18% | 0.03% | 0.14% | |
| CAD | 0.17% | 0.01% | -0.17% | -0.16% | -0.34% | -0.13% | -0.03% | |
| AUD | 0.31% | 0.15% | -0.02% | 0.15% | -0.19% | 0.03% | 0.17% | |
| JPY | 0.49% | 0.35% | 0.17% | 0.36% | 0.16% | 0.22% | 0.33% | |
| NZD | 0.28% | 0.15% | -0.05% | 0.11% | -0.05% | -0.22% | 0.12% | |
| CHF | 0.18% | 0.04% | -0.14% | 0.03% | -0.15% | -0.33% | -0.10% |
The heat map shows percentage changes of major currencies against each other. The base currency is picked from the left column, while the quote currency is picked from the top row. For example, if you pick the Euro from the left column and move along the horizontal line to the Japanese Yen, the percentage change displayed in the box will represent EUR (base)/JPY (quote).
USD/JPY Technical Outlook
The USD/JPY's downside push on Tuesday sees the pair challenging recent lows just north of the 147.00 handle, and the Dollar-Yen pairing is seeing further downside play on the low side of the 50-day Simple Moving Average (SMA).
The early week's near-term swing high into the 149.70 area sees the 50-day SMA now acting as technical resistance for immediate moves higher, and further downside will see the USD/JPY slipping into the chart territory below 147.00.
The USD/JPY remains firmly well-bid in the long-term, trading under 3% back from the year's highs near 152.00, and the pair is still up almost 14% from 2023's lows near 127.20.
USD/JPY Daily Chart

USD/JPY Technical Levels