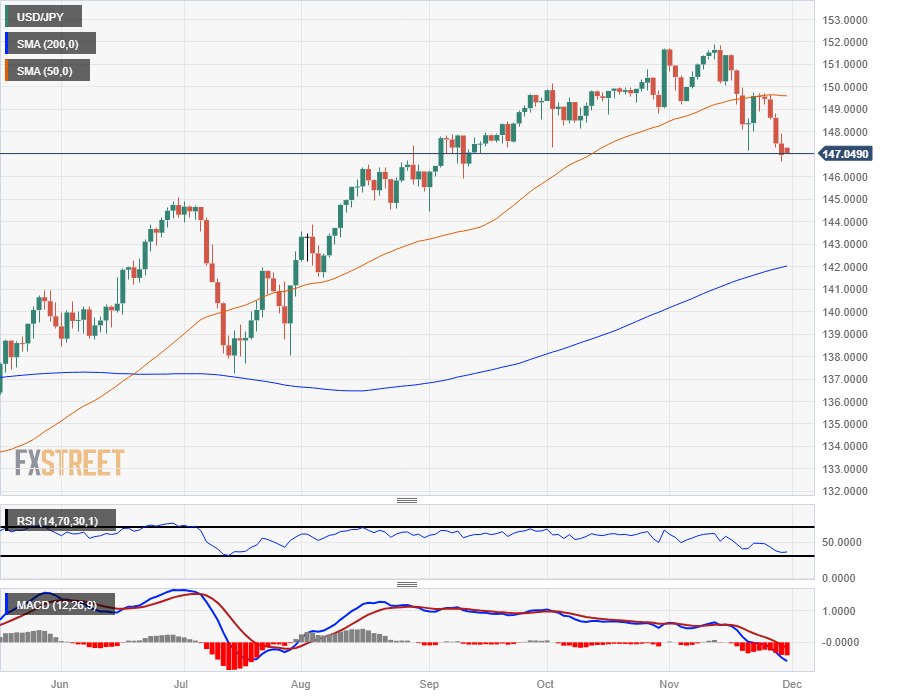
USD/JPY trading into 147.00 ahead of Japan Retail Trade, China PMIs loom over Asia markets
- The USD/JPY is testing the 147.00 handle ahead of Japan's latest Retail Sales print.
- Markets are forecasting a slight uptick in annualized Retail Trade in October.
- China's NBS Manufacturing PMIs due early in Asia session, to highlight market action.
The USD/JPY drifted lower in the back half of Wednesday's trading session after hitting an intraday peak just above 147.80. The pair closed out the midweek session near where it started, close to the 147.00 handle.
Japan's Retail Trade figures are due early in the Pacific trading session, and markets are forecasting a slight uptick in retail trade, with annualized Retail Trade in October expected to tick up from 5.8% to 5.9%. Japanese Industrial Production for the month of October is also expected to improve from 0.5% to 0.8%, and markets will be looking for a healthy print in Japanese Large Retailer Sales for October, which last came in at an even 5.0% in September.
Chinese NBS Purchasing Managers' Index (PMI) figures will be the highlight of the early Thursday trading window, and will set the tone for the rest of the early trading day.
Chinese PMIs are both expected to print slight gains, with the Non-Manufacturing PMI forecast to improve from 50.6 to 51.1 in November, while the headline Manufacturing PMI is expected to inch closer back towards expansionary territory, forecast to edge upwards from 49.5 to 49.7.
Later on Thursday will be another reading of the US Core Personal Consumption Expenditure (PCE) Price Index for October, and markets are expecting the Federal Reserve's (Fed) favorite inflation metric to tick down slightly from 0.3% to 0.2% in the MoM figure as inflation continues to ease back in the US domestic economy.
USD/JPY Technical Outlook
The USD/JPY's downside on Wednesday sees the pair close in the red for a fifth straight day, and the pair is continuing to drift lower after seeing a technical rejection from the 50-day Simple Moving Average (SMA) in the last swing high into 149.50.
The pair has been trading steadily lower after failing to claim the 152.00 major handle in early November's trading, and the pair is set to see technical congestion with price action trading on the south side of the 50-day SMA with long-term prices getting technical support from the 200-day SMA near 142.00.
USD/JPY Daily Chart

USD/JPY Technical Levels