NZD/USD Price Analysis: Clings to gain as an evening star looms
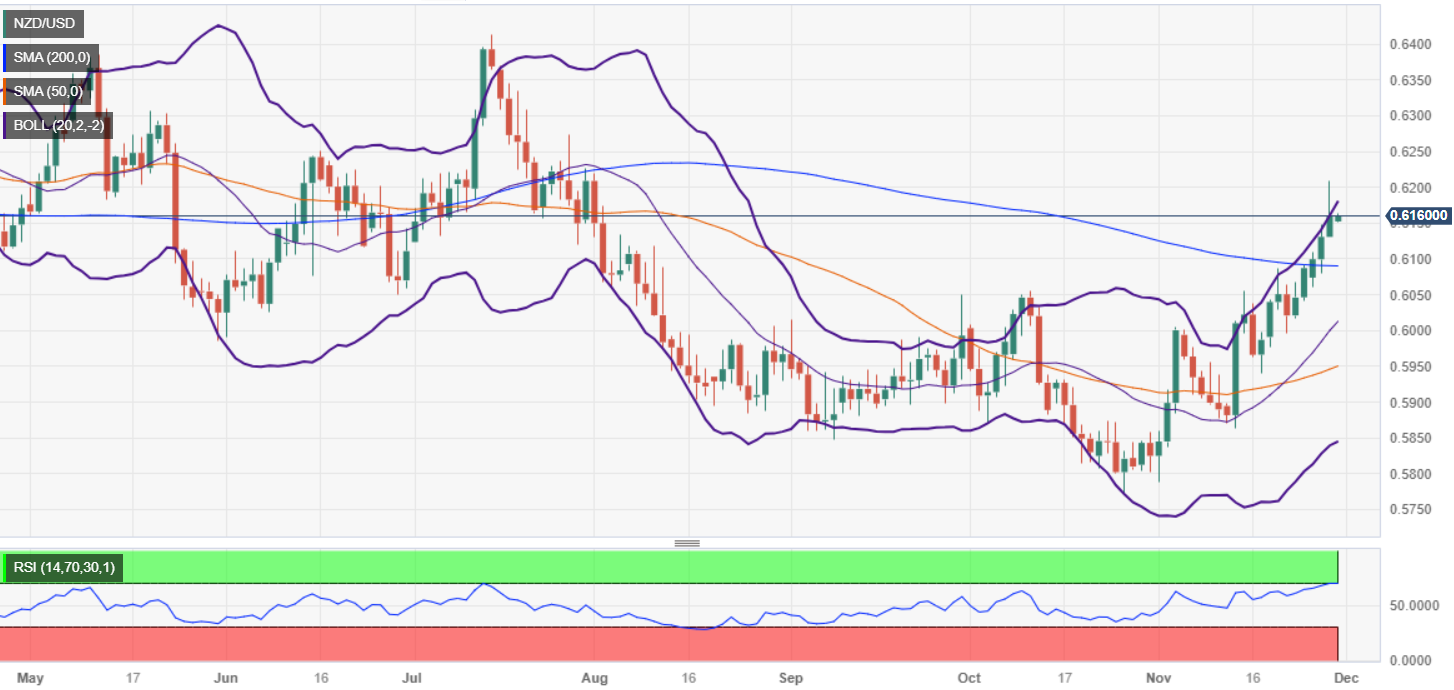
- An inverted hammer in the NZD/USD daily chart, could pave the way for a formation of an evening star, a bearish chart pattern.
- If sellers drag prices below the 200-DMA, that could pave the way toward 0.6000.
- Otherwise, buyers keeping the exchange rate above 0.6100, and the pair could edge toward 0.6200 and beyond.
The NZD/USD registered slim gains on Wednesday after reaching a multi-month high of 0.6208 but retreated and closed at around the 0.6150ish area, forming an inverted hammer. Hence, if the pair slides below the November 29 swing low of 0.6126, that could form an evening star that could send the pair drifting lower.
The daily chart portrays the pair upwards, but price action on Wednesday keeps sellers hopeful of pushing the exchange rates lower to test the 200-day moving average (DMA) at 0.6089. That would form an evening star, with downside risks emerging below the latter, like the latest swing low seen at 0.5996, the November 22 low.
Conversely, if NZD/USD stays above 0.6100 and buyers reclaim 0.6200, that would put into play key resistance levels. Firstly, the July 31 daily high at 0.6225, followed by the July 27 swing high at 0.6273 shy of the 0.6300 mark.
NZD/USD Price Analysis – Daily Chart
NZD/USD Technical Levels