NZD/JPY bulls take a breather after getting rejected at cycle highs
- NZD/JPY sees a 0.20% uptick, hovering around 90.60 after getting rejected at the cycle high 91.20.
- Indicators on the shorter time frames suggest that the bears are stepping in.
- The bullish trend is intact on a broader scale.
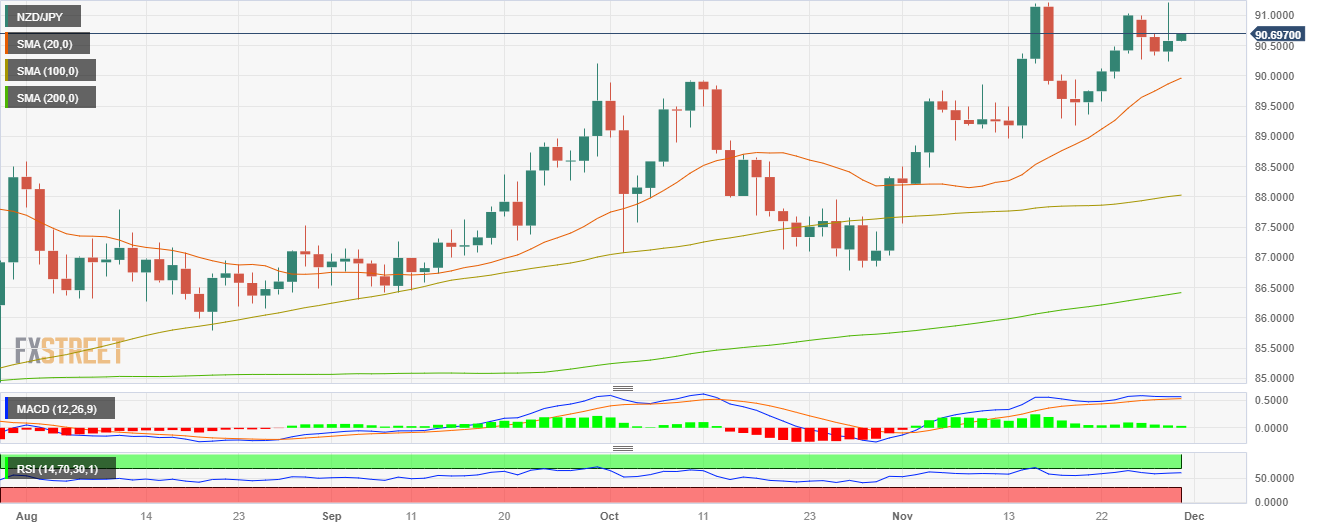
In Wednesday's session, the NZD/JPY is trading at 90.60, modestly higher by 0.20%, retreating from a cycle high of 91.20. The pair's trajectory remains neutral to bullish on the daily chart, as bulls seem to be taking a hiatus after being rebuffed twice at cyclical peaks. On the four-hour chart, indicators suggest that bears are subtly reclaiming influence.
Daily chart indicators reflect a relatively flat yet bullish posture for the NZD/JPY. The Relative Strength Index (RSI) is in positive territory but flat, indicating a minor cooldown in the bullish momentum, perhaps due to the bulls taking a little breather following their pronounced exertions. The Moving Average Convergence Divergence (MACD) histogram echos this sentiment with flat green bars, hinting at sustained but static buying momentum.
Simultaneously, a broader outlook presents an optimistic case. This is captured by the positioning of the pair in relation to its three key Simple Moving Averages (SMAs): the 20-day, 100-day, and 200-day, respectively.
However, switching to the four-hour chart uncovers signs of increasing bearish momentum. Here, the Relative Strength Index (RSI) reveals a negative slope despite being in the positive territory - indicative of the bears ramping up their might. Concurrently, printing read bars, the Moving Average Convergence Divergence (MACD) suggests that the bears are gaining momentum.
Support Levels: 89.85 (20-day SMA), 89.30, 89.00.
Resistance Levels: 91.00, 91.20, 91.30.
NZD/JPY daily chart
