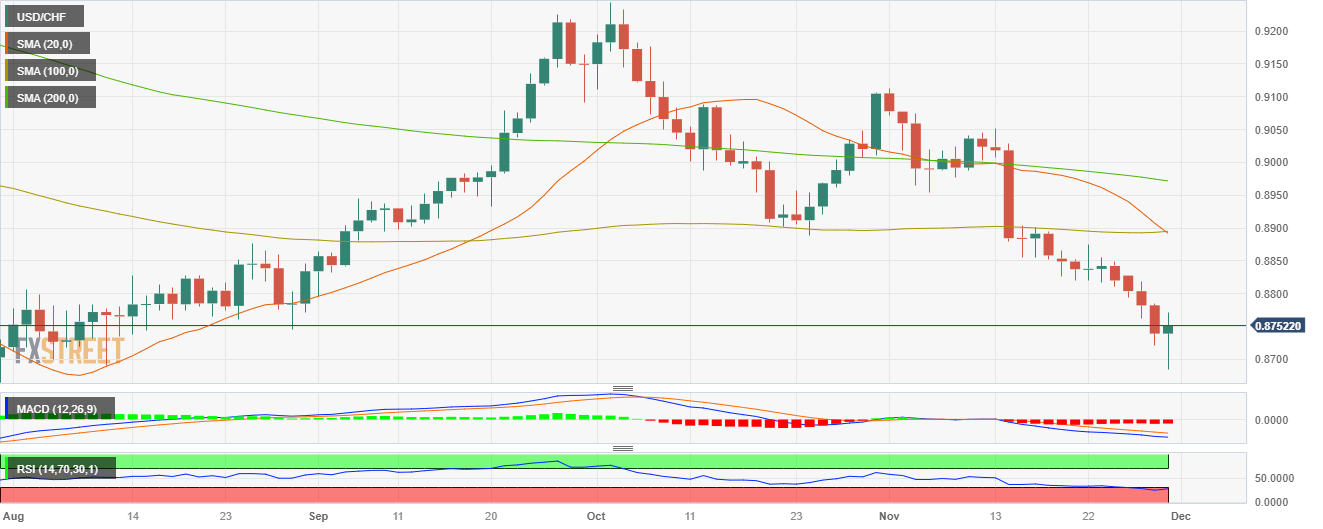
USD/CHF ascends amid sticky inflation fears and rising yields from US PCE figures
- The USD/CHF pair currently hovers near the 0.8750 level with marginal gains after hitting a low on July 31, earlier in the session of 0.8685.
- US PCE figures showed no surprises in October but warned markets about stubborn inflation.
- Rising yields lured investors to the USD, whose DXY index rose to 103.50, up by 0.50%.
The USD/CHF started the Thursday trading session negatively, dropping to 0.8685, setting fresh multi-month lows but then settling around 0.8750, courtesy of a strengthening of the US Dollar. Among the catalysts inciting this uptick are the US Personal Consumption Expenditures (PCE) figures warning about sticky inflation and surging yields fueling the Dollar's demand.
In that sense, the US Bureau of Economic Analysis reported that the annual PCE Price Index for October remained at 3%, showing a slight decrease from the previous rate of 3.4%. Similarly, the annual Core PCE Price Index for October matched consensus expectations at 3.5%, signalling a decline from the preceding rate of 3.7%. These figures have tempered market enthusiasm and support the cautious stance of the Federal Reserve (Fed) as they seek more evidence of inflation declining.
Recently, Fed officials refrained from calling a victory on inflation and argued that the bank needed to see more evidence of inflation cooling down in order to end the tightening cycle. It is not very likely that the Fed will hike in the next December meeting, but the question arises of how long it will maintain rates at restrictive levels. It will all come down to the incoming data, and on Friday, the US will report the Institute for Supply Management’s (ISM) Manufacturing PMI for November. Chair Powell will also be on the wires and investors will look for any evidence on forward guidance.
Elsewhere, the US government bond yields are rising, with the 2-year rate standing at 4.71% and the 5 and 10-year yields at 4.29% and 4.34%, respectively.
USD/CHF levels to watch
Based on the indicators on the daily chart, the selling momentum appears dominant in the current pair, and sellers seem to be taking a break. Specifically referring to the Relative Strength Index (RSI), a flat oversold condition signals a strong bearish pressure but hints at a potential reversal. This is further emphasised by the Moving Average Convergence Divergence (MACD), where flat red bars support the sellers' scenario.
The Simple Moving Averages (SMAs) paint a similar picture. The forex pair resides below the 20, 100, and 200-day SMAs, a condition usually characteristic of a bear-controlled marketplace. But it's worth noticing that bears are currently taking a breather, which could lead to an upcoming temporary bullish pullback. Yet, the underlying trend remains strongly bearish since the pair managed to hit lows last seen in late July earlier in the session.
Support Levels: 0.8725, 0.8685, 0.8650.
Resistance Levels: 0.8800, 0.8830, 0.8900.
USD/CHF daily chart
