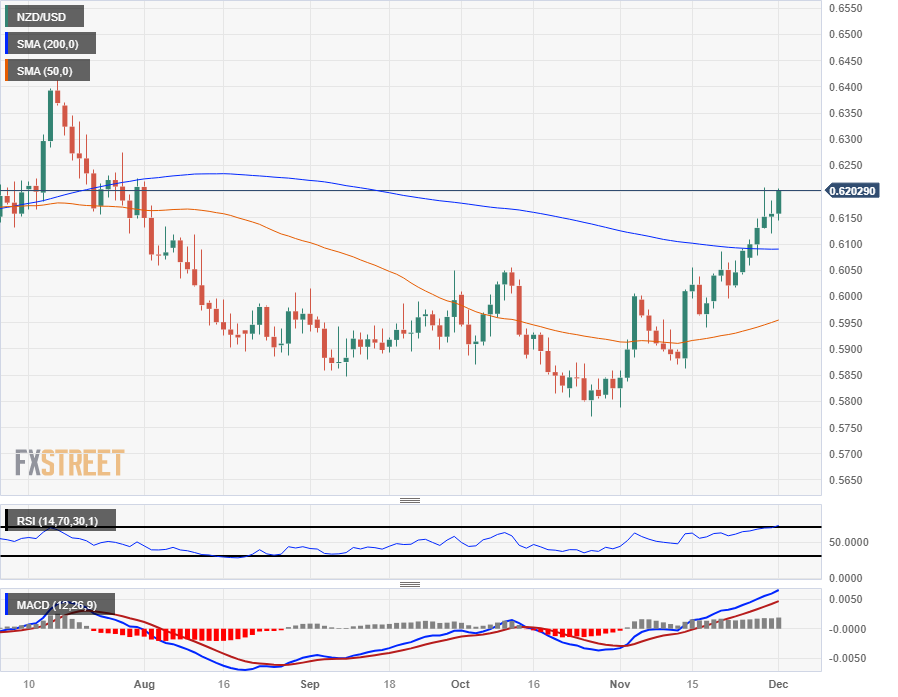
NZD/USD re-taps 0.6200 for the second time in a week as hawkish RBNZ bolsters Kiwi
- The NZD/USD gains three-quarters of a percent on Friday to etch in a seventh straight gain.
- The Kiwi is up 2% against the US Dollar heading into the tail end of Friday's trading session.
- Thin Kiwi data next week gives way to another bout of US NFP data next Friday.
The NZD/USD is continuing its climb as the Kiwi (NZD) stands out as the single best-performing currency of the major currencies bloc, up 2% against the US Dollar (USD) for the trading week.
An improving economic outlook coupled with a hawkish Reserve Bank of New Zealand (RBNZ) is bolstering the NZD across the board. The Kiwi is climbing into the 0.6200 handle against the Greenback for the second time in three days.
The RBNZ held interest rates at 5.5% this week, but a hawkish stance from New Zealand’s central bank is propping up the Kiwi, with RBNZ officials actively weighing additional rate hikes with inflation continuing to fall outside of the RBNZ’s target 1-3% band for so long.
Consumer sentiment and business outlook surveys continue to rise, with the New Zealand ANZ Roy Morgan Consumer Confidence survey index rising to a yearly high of 91.9 early Friday, adding further momentum to the NZD/USD heading into the week’s end.
Next week has a fairly thin showing for the Kiwi on the economic data calendar, but eyes will be turning towards next Friday’s US Non-Farm Payrolls release, where the US is expected to see a marginal gain in the number of new job hires from 150K to 170K in November.
NZD/USD Technical Outlook
The NZD/USD is set to close in the green for twelve of the last fourteen consecutive trading days, and as long as the pair holds near the 0.6200 handle into the Friday closing bell that will etch in seven straight days of gains.
The Kiwi-Dollar pairing has climbed 7.5% from October’s bottom bids of 0.5772, and a continuation of recent bullish momentum will see a new long-term trend form up and take a challenge run at July’s swing high into 0.6400.
The NZD/USD easily slipped through the 200-day Simple Moving Average (SMA) last week as the Kiwi’s near-term trend rotates firmly bullish, and bulls will be fresh and ready for a leg higher as long as a retracement doesn’t take the pair back below the 200-day SMA at the 0.6100 handle.
NZD/USD Daily Chart

NZD/USD Technical Levels