AUD/NZD Price Analysis: Aussie struggles to develop a bounce against Kiwi, stuck near 1.0730
- The AUD/NZD has been bolted to chart territory north of 1.0700 in the near-term.
- The Aussie's tumble last week has seen little paring back as the pair waffles in the midrange.
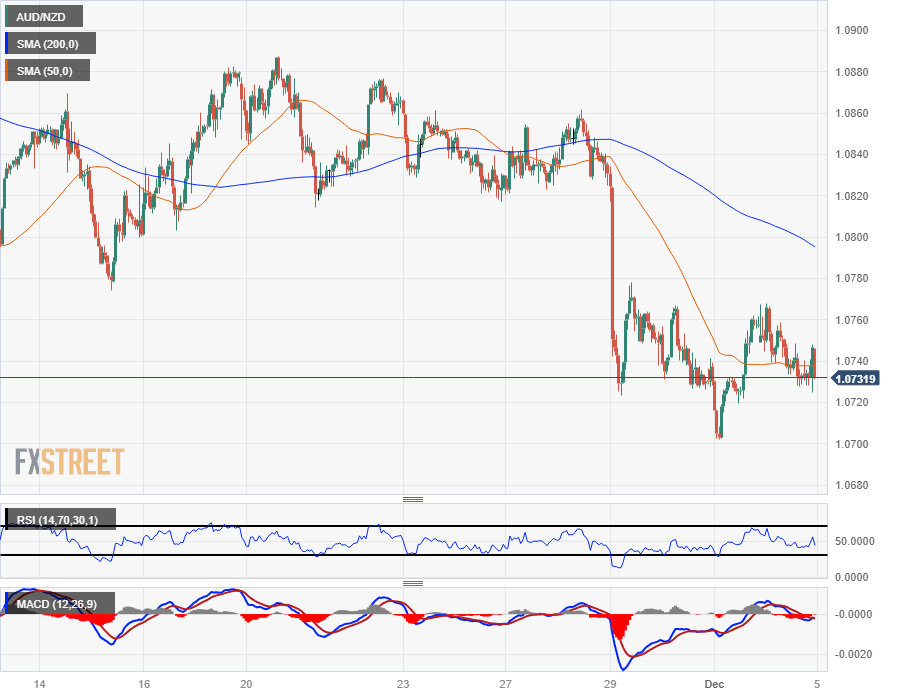
The AUD/NZD has been stuck near 1.0730 since a backslide from 1.0860 last week, and the Aussie-Kiwi pairing tumbled out of a near-term consolidation range to trade into an entirely new range just north of the 1.0700 handle.
A near-term technical floor is firming up at the 1.0730 price level, and intraday upside swings that fail to generate bullish momentum see a technical ceiling capping off upside price action from 1.0770.
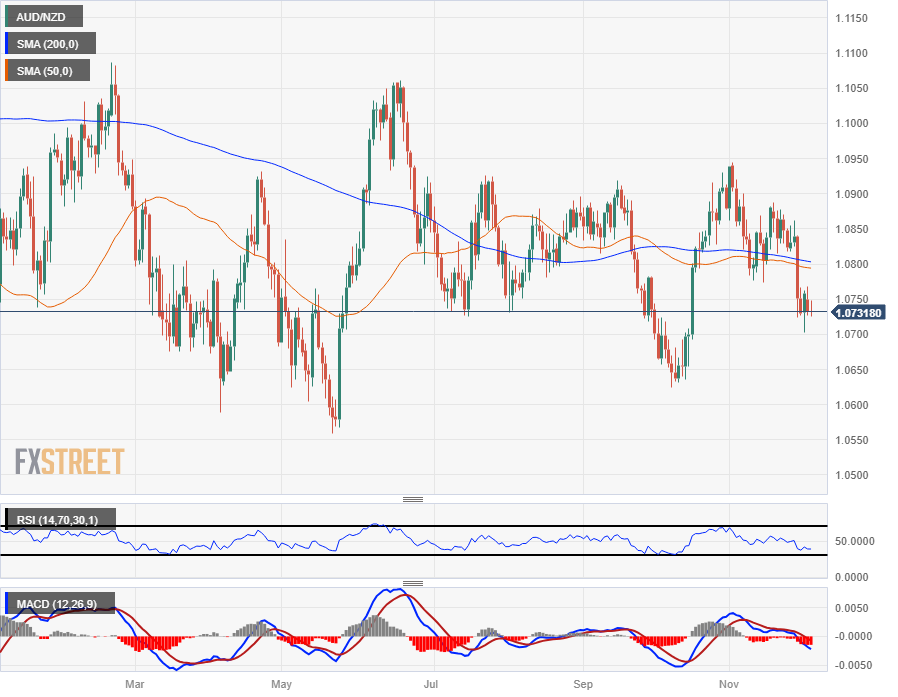
On the daily candlesticks, the AUD/NZD is set to see some technical consolidation before returning to the upside somewhere north of the 200-day Simple Moving Average (SMA), which has been consolidating with the 50-day SMA near the 1.0800 handle since mid-July.
Sideways chart churn has been the name of the game for the AUD/NZD through most of 2023's trading action, and if seller's aren't able to kick in a short extension below 1.0700, bidders will be taking the reigns to send the AUD/NZD back into recent swing highs near 1.0850.
AUD/NZD Hourly Chart

AUD/NZD Daily Chart
 AUD/NZD Technical Levels