WTI Price Analysis: Oil prices drop as the USD recovers, OPEC cuts
- WTI declined towards $73.25, seeing 1.50% losses.
- The US Dollar measured by the DXY index rose towards 103.70, weighting on the black gold.
- Doubts on further production cuts by OPEC also apply pressure on the price.
At the start of the week, the West Texas Intermediate (WTI) barrel tallied a third consecutive day of losses, triggered by the strength of the US Dollar and the speculation amongst traders that the Organization of the Petroleum Exporting Countries (OPEC) won't deliver any more production cuts after its last decision.
Last week, the OPEC+ countries, spearheaded by Saudi Arabia, collectively decided to significantly reduce their oil production by approximately 2.2 million barrels per day (bpd) for the early part of next year. That being said, the reaction of the Oil prices was to the downside as markets were disappointed in the size of the cuts and were left sceptical about further reductions in the future.
In addition, the global uncertainty of the global demand for black gold opens the downside for the WTI, with major global economies starting to see the effects of their contractive monetary policies on their economies. In line with that, the US will report key labor market figures this week, ending with a Nonfarm Payrolls report on Friday, and their outcome will likely shape the upcoming decisions from the Federal Reserve (Fed). If the data justifies further tightening, the American economy (the largest Oil consumer) may face additional challenges that could negatively affect the oil demand.
WTI Levels to watch
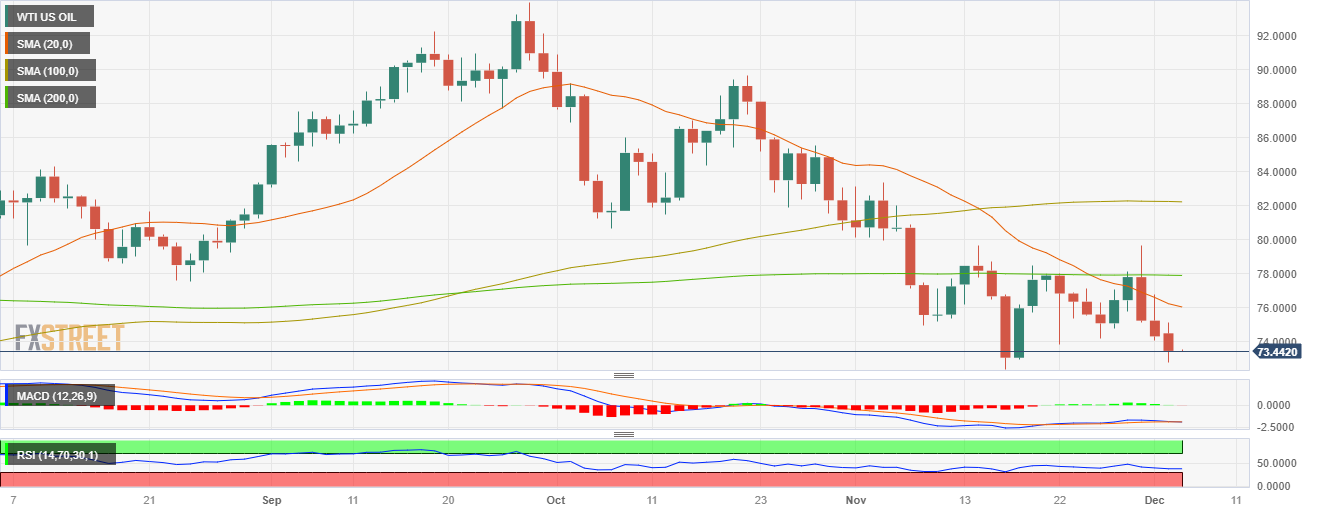
According to the daily chart, the outlook has turned bearish for the WTI. This is mainly because the Relative Strength Index (RSI) and Moving Average Convergence Divergence (MACD) reside deep in negative territory and as the price is seen below its 20,100 and 200-day Simple Moving Averages (SMA). This indicates that on the shorter and broader scales, the sellers are dominating.
Resistance Levels: $75.00, $76.15 (20-day SMA), $77.00.
Support Levels: $72.80, $72.30,$71.00.
WTI Daily chart
