NZD/JPY bears gain traction on fundamental catalyst, oversold conditions on the four-hour charts
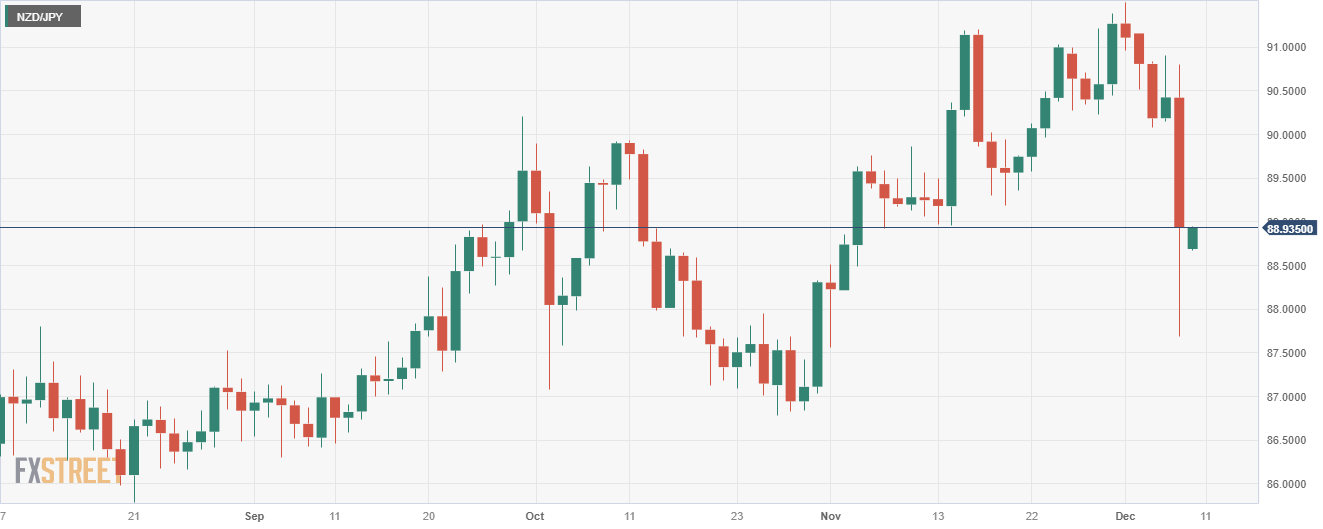
- NZD/JPY experienced a 1.60% downslope, consolidating at 88.90 after falling to 87.70.
- Hawkish bets on the BoJ and speculations of a liftoff are responsible for the strength of the JPY.
- The daily chart reveals a negative RSI slope and increasing red MACD Bars, suggesting a strong bearish momentum.
In Thursday's session, the NZD/JPY pair is trading bearish at around 88.90 after hitting a low of around 87.70. As indicated by the daily and four-hour charts, bears are currently dominating with their strength becoming more evident in shorter time frames.
In that sense, the Relative Strength Index (RSI) suggests that selling pressure is dominant given its negative trajectory currently within a negative range, while the Increasing red bars on the Moving Average Convergence Divergence (MACD) also indicate that the bearish momentum might be picking up speed.
Concerning Simple Moving Averages (SMAs), the pair lies below the 20-day average but above the 100-day and 200-day SMAs. This indicates that in the short term, there is bearish pressure but that in the larger time frame, bulls are still in command.
Switching the focus to the smaller timeframes, the four-hour chart also implies that the sellers are building force. The Relative Strength Index (RSI) shows an oversold condition but is currently flat, while the MACD is demonstrating rising red bars, adding more weight to the bearish viewpoint.
Support Levels: 88.55, 88.15 (100-day SMA), 87.70.
Resistance Levels: 89.25, 89.80, 90.00 (20-day SMA).
NZD/JPY daily chart
