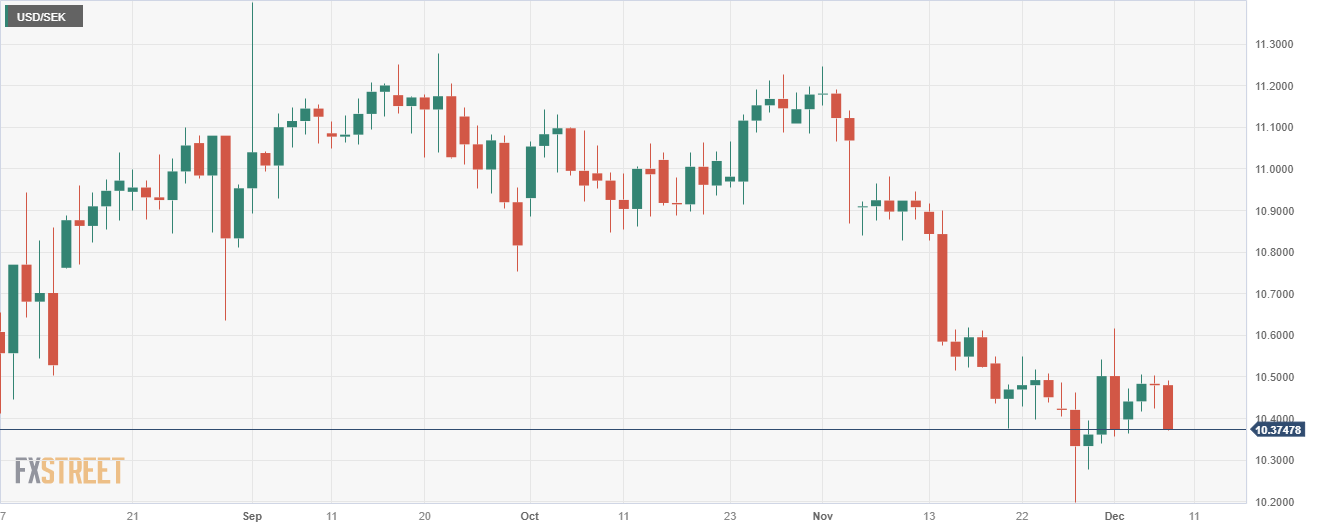
USD/SEK dips ahead of US labor market data despite lower Jobless Claims
- The USD/SEK is down by 0.35%, hovering near the 10.370 level.
- US reports Initial Jobless Claims at 220,000 for the week ending December 2.
- US bond yields are rising ahead of Friday’s NFPs.
The USD/SEK pair shows a downward course in Thursday's session, falling towards the 10.370 mark. The primary driver of this movement is a broad US Dollar weakness, which is consolidating weekly gains ahead of key labor market data on Friday.
On the data front, the U.S. Department of Labor reported that Initial Jobless Claims for the week ending in December 2 stood at 220,000. The figure was somewhat lower than the forecasted 222,000 but increased from its previous 218,000 claims, suggesting a marginally positive outlook in the labor market.
On Friday, the US will disclose a series of key labor market indicators that will shape the expectations for the next Federal Reserve (Fed) decisions. The Nonfarm Payrolls, Unemployment Rate and Average Hourly Earnings from November will be released by the U.S. Bureau of Labor Statistics, and while the Payroll figures are projected to reach 180,000, moving up from the previous 150,000, the wage growth ratio is anticipated to decrease to 4% YoY from the former 4.1%. The Unemployment rate is seen remaining steady at 3.9%.
Meanwhile, US Treasury yields are on an ascent. The 2-year yield is trading at 4.6o%, while the 5-year and 10-year yields both stand at around 4.12%. A rise in these yields positively influences the USD value, so the pair's losses may be limited. However, the rhetoric that dominates the market is that the Fed will take a less aggressive approach in light of the recent readings of cooling inflation and evidence of the labor market rebalancing. However, those expectations will be shaped by the incoming data as the bank still remains data-dependent and didn’t rule out further tightening.
USD/SEK levels to watch
According to the daily chart, the USD/SEK has a bearish outlook for the short term. The Relative Strength Index (RSI) shows a negative slope yet remains in positive territory, a hint of selling pressure being supported by the rising red bars of the Moving Average Convergence Divergence (MACD), suggesting a strengthening selling momentum.
In addition, the pairs reside below the 20,100 and 200-day Simple Moving Averages (SMAs), which suggests that the sellers are in command in the broader outlook.
Support Levels: 10.360, 10.350, 10.327.
Resistance Levels: 10.492 (20-day SMA), 10.500, 10.520.
USD/SEK daily chart
