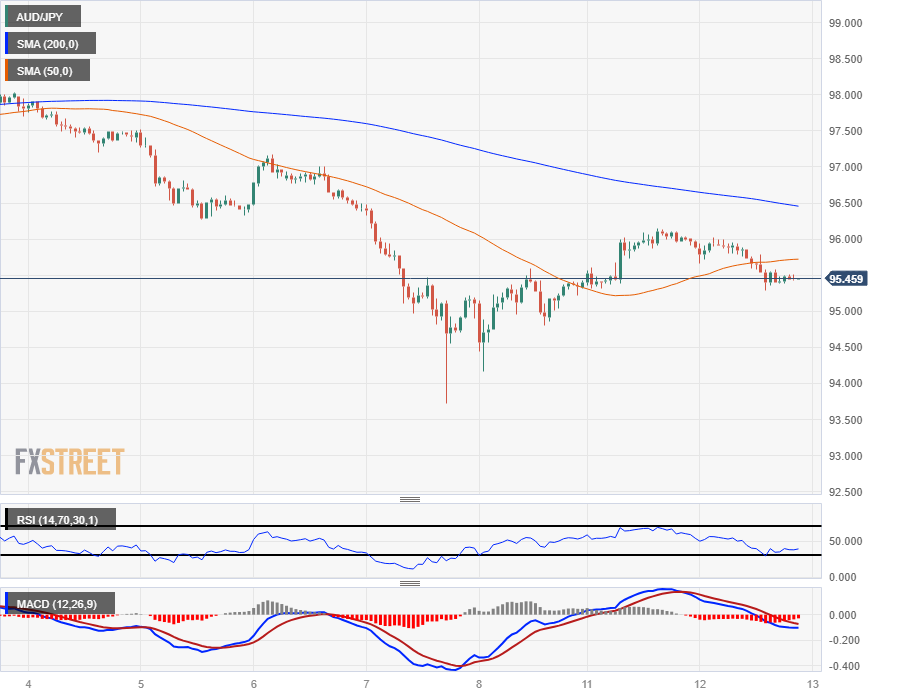
AUD/JPY turning down after rejection from 96.00
- The AUD/JPY is struggling to develop bullish momentum, struggling below 96.00.
- Aussie data continues to pull the rug out from beneath the AUD.
- This week sees a steady smattering of Aussie and Japan data, forecasts remain mixed.
The AUD/JPY couldn’t hold the 96.00 handle on Tuesday, falling back into 94.50 through the day and settling back into the low end. The Australian Dollar (AUD) is one of the worst-performing currencies on Tuesday, falling back against nearly all major currencies on the FX boards for the day.
Early Wednesday brings Japanese Tankan Large Manufacturing Index figures for the fourth quarter, forecast to tick up from 9.0 to 10.0. Tankan Large All Industry Capex for the fourth quarter is forecast to tick down slightly from 13.6% to 12.4%, while the Manufacturing Outlook is expected to shift down from 10.0 to 9.0.
Australian data has been thin this week, though Westpac’s Consumer Confidence for December recovered from -2.6% to 2.7% early Tuesday, providing only minor support for the Aussie (AUD).
Looking further out into the week, Thursday will see Australian employment figures, to be followed up by Judo Bank Purchasing Manager Index (PMI) data early Friday. Aussie Employment Change for November is forecast to shift down from 55K to only 11K, while Friday’s Preliminary Judo Bank Composite PMI for December last came in at a low of 46.2, and further downside could be on the cards as the Australian economy continues to wobble.
Australian Dollar price today
The table below shows the percentage change of Australian Dollar (AUD) against listed major currencies today. Australian Dollar was the strongest against the Canadian Dollar.
| USD | EUR | GBP | CAD | AUD | JPY | NZD | CHF | |
| USD | -0.31% | -0.12% | 0.08% | 0.08% | -0.40% | -0.16% | -0.34% | |
| EUR | 0.31% | 0.18% | 0.40% | 0.38% | -0.11% | 0.14% | -0.04% | |
| GBP | 0.12% | -0.19% | 0.21% | 0.20% | -0.28% | -0.03% | -0.22% | |
| CAD | -0.09% | -0.38% | -0.22% | 0.02% | -0.49% | -0.25% | -0.43% | |
| AUD | -0.08% | -0.39% | -0.22% | 0.02% | -0.50% | -0.24% | -0.44% | |
| JPY | 0.40% | 0.08% | 0.27% | 0.48% | 0.50% | 0.24% | 0.06% | |
| NZD | 0.15% | -0.15% | 0.04% | 0.25% | 0.24% | -0.25% | -0.19% | |
| CHF | 0.33% | 0.04% | 0.22% | 0.44% | 0.44% | -0.07% | 0.19% |
The heat map shows percentage changes of major currencies against each other. The base currency is picked from the left column, while the quote currency is picked from the top row. For example, if you pick the Euro from the left column and move along the horizontal line to the Japanese Yen, the percentage change displayed in the box will represent EUR (base)/JPY (quote).
AUD/JPY Technical Outlook
The Aussie has steadily shed weight against the Japanese Yen in December, declining from the 98.00 handle to test into 94.00 last week, and seeing only a limited recovery that sees the AUD/JPY still capped off by a bearish 200-hour Simple Moving Average (SMA) near 96.50.
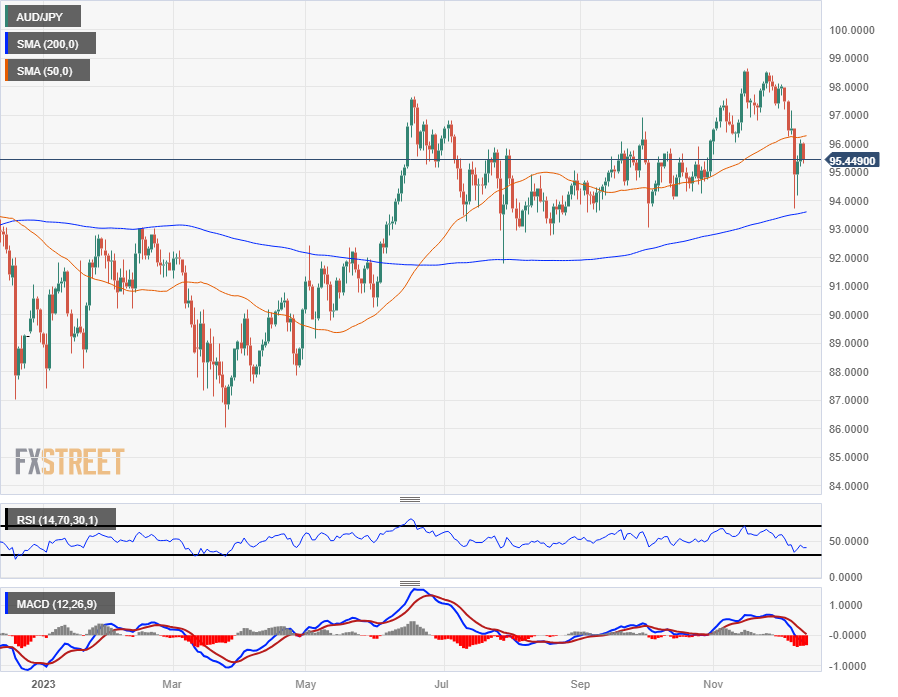
Daily candlesticks have the AUD/JPY down from November’s peaks near 98.50, but medium-term momentum continues to find technical support from the 200-day SMA rising into the 94.00 handle.
Bullish momentum remains limited with bids cycling the 50-day SMA since a bullish cross of the 200-day SMA in June near 92.00.
AUD/JPY Hourly Chart

AUD/JPY Daily Chart

AUD/JPY Technical Levels