WTI Crude Oil reclaims $70 as oil markets recover post-Fed
- Crude Oil is looking for a rebound after getting knocked back into five-month lows.
- WTI is clawing back into $70 after backsliding to $68, a low not seen since June.
- A drawdown in Crude Oil stocks is helping to prop up battered barrel prices.
West Texas Intermediate (WTI) is scrambling to find a foothold near the $70-per-barrel handle. An extended backslide in Crude Oil sent WTI into the floorboards near $68, driven by overarching energy market concerns that slumping global demand for Crude Oil continues to undercut fierce production cuts from the Organization of the Petroleum Exporting Countries (OPEC).
Barrel count data from the Energy Information Administration (EIA) revealed an unexpected drawdown in US Crude Oil reserves, showing a 4.259 million decline in US barrel counts for the week ended December 8th. Markets were expecting a much smaller decline of 650K, compared to the previous week’s decline of 4.635 million barrels.
Despite the unexpected decline in barrel counts, US Crude Oil inventories remain a little above 440 million barrels, with the Cushing, Oklahoma facility recovering an additional 1.2 million barrels.
OPEC remains dedicated to drawing down production quotas to bolster Crude Oil prices, but markets remain skeptical that the oil cartel will successfully draw member states into adhering to stiff production caps. OPEC currently has no policy framework or mechanisms in place to force member states to produce beyond quota caps, nor to punish members for failing to adhere to production and selling quotas.
The US Federal Reserve (Fed) gave a dovish showing on Wednesday, helping to bolster broad-market risk appetite as the US central bank officially embraces the end of the rate hike cycle, though Fed Chair Jerome Powell was quick to warn that more rate hikes wouldn't be off the table if inflation returns to being a problem.
WTI Technical Outlook
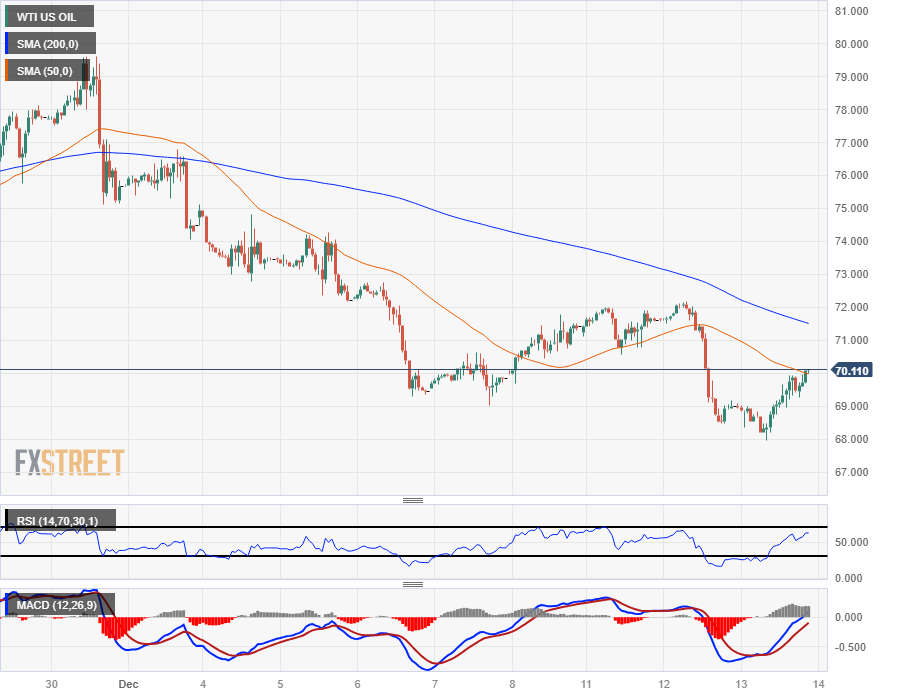
WTI’s Wednesday rebound sees WTI clambering back into $70, but US Crude Oil remains deeply in the cut, trading on the south side of the 200-hour Simple Moving Average (SMA) near $71.50. WTI hasn’t come within touch range of the 200-hour SMA since intraday bids dropped away from the moving average at the beginning of December when barrel prices dropped from $76.50.
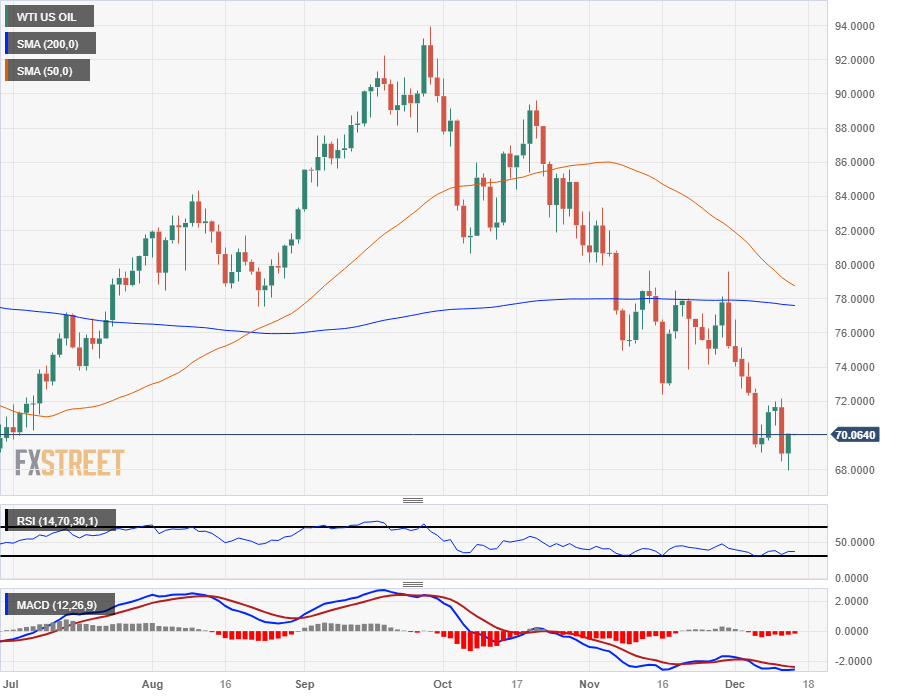
Daily candlesticks have WTI trading firmly into bear country, trading below the 200-day SMA near the 78.00 handle as oil bulls struggle to keep Crude Oil above six-month lows near the $67.00 handle. Oil bidders will have their work cut out for them as the 50-day SMA sets up for a bearish crossover of the 200-day SMA.
WTI Hourly Chart

WTI Daily Chart

WTI Technical Levels