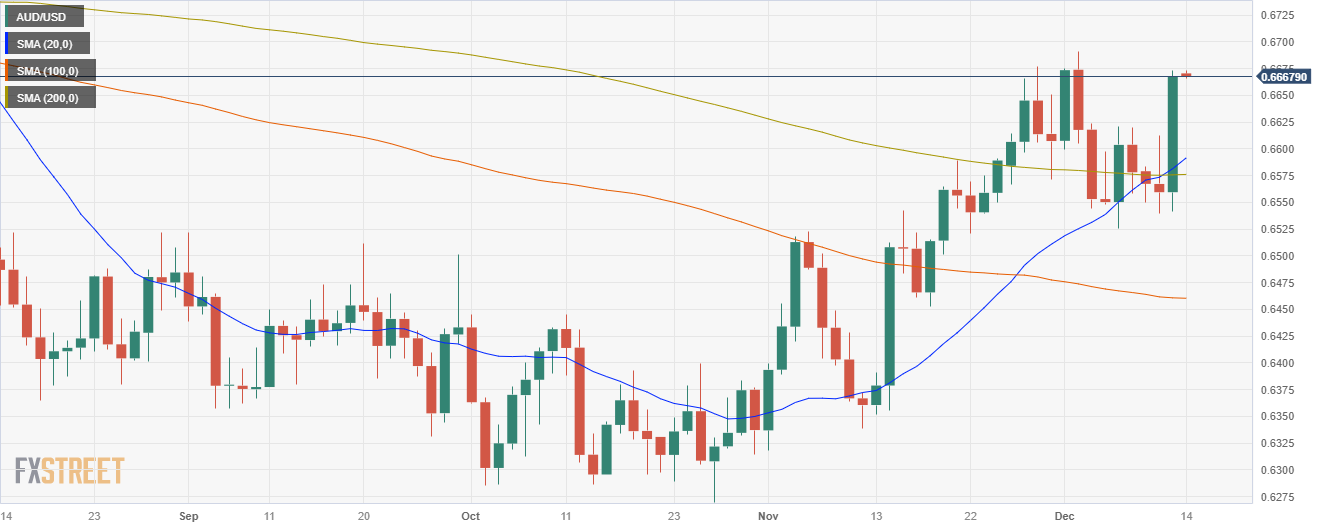
AUD/USD bulls seizes control and charge towards multi-month highs around 0.6670
- The AUD/USD gathered significant momentum at 0.6670, posting a 1.60% rise.
- With the RSI on a positive track and the MACD histogram demonstrating ascending green bars, the daily chart suggests increasing buying momentum.
- Indicators, including an overbought RSI on the four-hour chart, imply possible correction.
On Wednesday's session, the AUD/USD rose to 0.6670, witnessing an upward rally of 1.60%. The recent price action suggests bullish dominance on the daily chart, with buyers gaining significant ground. However, on the four-hour chart, overbought conditions have been signaled, indicating a potential shift in momentum.
From a technical standpoint, the daily chart indicators are depicting a distinctive bullish scenario. The Relative Strength Index (RSI) presents an upward trajectory, nestled securely within positive territory. This signals a strong buying momentum dominating the market currently. Coinciding with this, the Moving Average Convergence Divergence (MACD) is highlighting an increase in green bars, lending further weight to the bullish momentum. What further bolsters the positive bias are the Simple Moving Averages (SMAs) as the pair trades comfortably above its 20, 100, and 200-day SMAs, a clear indication that control resides firmly with the bulls over the long haul.
Switching focus to the four-hour chart, the overall momentum still skews towards the bullish side. The Relative Strength Index (RSI) on the four-hour chart signals overbought conditions, an indication of intense buying pressure. Correspondingly, the MACD on the four-hour scale echoes this bias with rising green bars. Even though these conditions might suggest a potential pullback due to the overextended nature of the rally, the buying momentum appears to still hold the upper hand.
Support Levels: 0.6580 (20 and 200-day SMA convergence), 0.6540, 0.6500.
Resistance Levels: 0.6695, 0.6730, 0.6750.
AUD/USD daily chart
