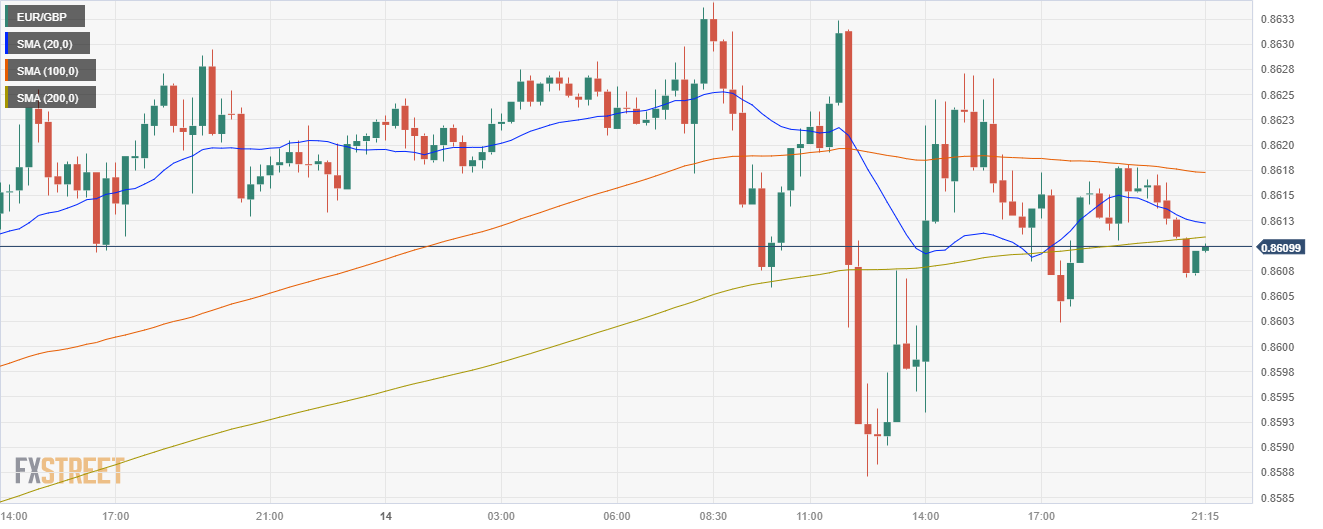
EUR/GBP shows slight losses,rejected by SMA convergence
- The EUR/GBP stays steady around 0.8610, incurring minor after two days of gains.
- Key indicators on the daily chart depict a sluggish buying momentum.
- The pair struggles against the prevailing bearish strength it trades below its main SMA.
In Thursday's session, the EUR/GBP traded at a slight loss, remaining pinned at 0.8610. On the daily chart, the broader outlook appears neutral to bearish, with buyers pausing for breath. Despite three prior days of gains, the bulls seem to struggle to gain traction, while four-hour indicators show a flat yet positive trend.
The indicators on the daily chart reflect a steady bearish momentum on the daily chart. The pair continues to be suppressed under the 20, 100, and 200-day Simple Moving Averages (SMAs), emphasizing the dominant position of the sellers. The Relative Strength Index (RSI) is also in negative territory, signaling a continued downward momentum. A similar sentiment is mirrored by the Moving Average Convergence Divergence (MACD) as it exhibits red bars, indicating that the bears still have a grip on the market. Furthermore, traders should eye a potential bearish crossover around the 0.8630 area between the 20 and 100-day SMAs, which could ignite more downside movements.
In contrast, the situation on the four-hour chart is more balanced. The indicators are in a holding pattern, with the RSI and MACD flat in positive territory, suggesting an indecisive state. However, the flat, positive territory position of the RSI hints at some short-term bullish momentum, but it's not strong enough to overturn the broader bearish bias.
Support Levels: 0.8600, 0.8580, 0.8530.
Resistance Levels: 0.8635 (20 and 100-day SMA convergence), 0.8650, 0.8670.
EUR/GBP daily chart
