Kiwi struggles to maintain topside momentum, NZD/USD stuck near 0.6200
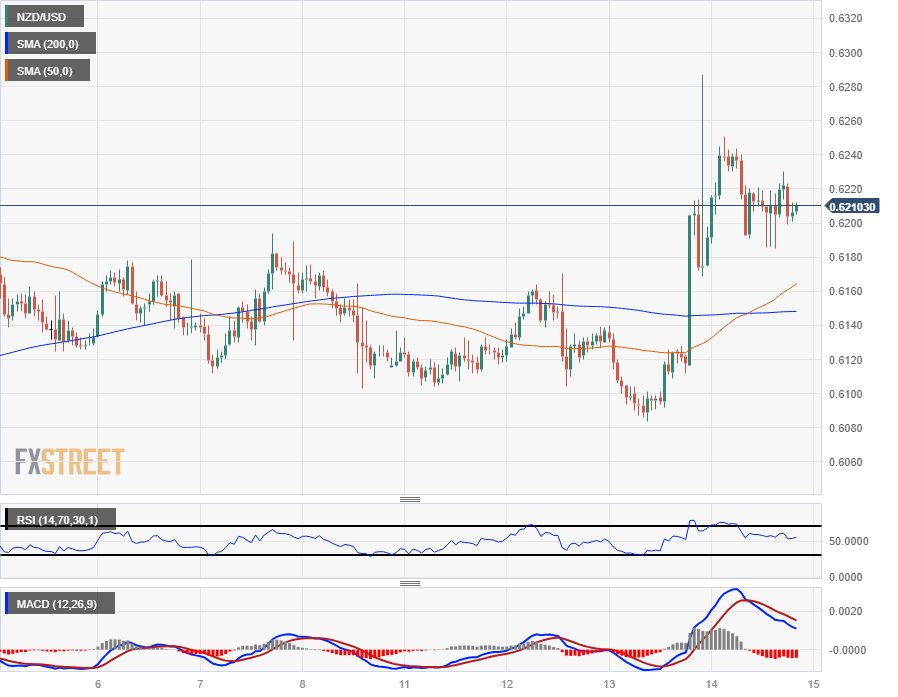
- NZD/USD is having a hard time pushing off the 0.6200 handle despite a mid-week run above 0.6280.
- Dovish Fed pivot has bolstered the broader FX market against the US Dollar, but Kiwi gains remain capped.
- NZ, US PMIs to round out the trading week.
The NZD/USD is struggling to find further gains rounding the corner into Friday’s early market session, trading close to the 0.6200 handle after a bull run over 0.6280 sputtered out and sent the pair slumping back into near-term consolidation.
Despite the US Dollar (USD) declining across the board following a dovish pivot from the Federal Reserve (Fed) on Wednesday, the Kiwi (NZD) has struggled to capitalize on the broad-market momentum, hobbled by New Zealand Gross Domestic Product (GDP) figures that broadly missed the mark early Thursday.
New Zealand’s third quarter GDP printed at -0.3%, an unexpected decline compared to the previous quarter’s 0.5% growth (revised down from 0.9%), completely missing the forecast 0.2%. Annualized GDP ended in the third quarter likewise declined, printing at -0.6% versus the expected 0.5% gain, and slipping back from the previous period’s 1.5% (also revised down from 1.8%).
A swamped GDP print has swamped the Kiwi, leaving the NZD as one of the worst performers of the major currency bloc, second only to the US Dollar.
The Business NZ Purchasing Managers’ Index (PMI) for November, due early in the Friday Asia market session, is unlikely to provide much hope for Kiwi bidders. NZ PMI last printed at 42.5 in October.
US S&P Global PMIs are expected to tick down slightly in Friday’s upcoming American session, which could provide additional support for risk pairs and extend downside pressure on the Greenback. December’s Preliminary Manufacturing PMI is forecast to tick down from 49.4 to 49.3.
NZD/USD Technical Outlook
The NZD/USD is waffling on the intraday charts, strung along the 0.6200 handle as the 50-hour Simple Moving Average (SMA) climbs into 0.6170 following a bullish cross of the 200-hour SMA at 0.6150.
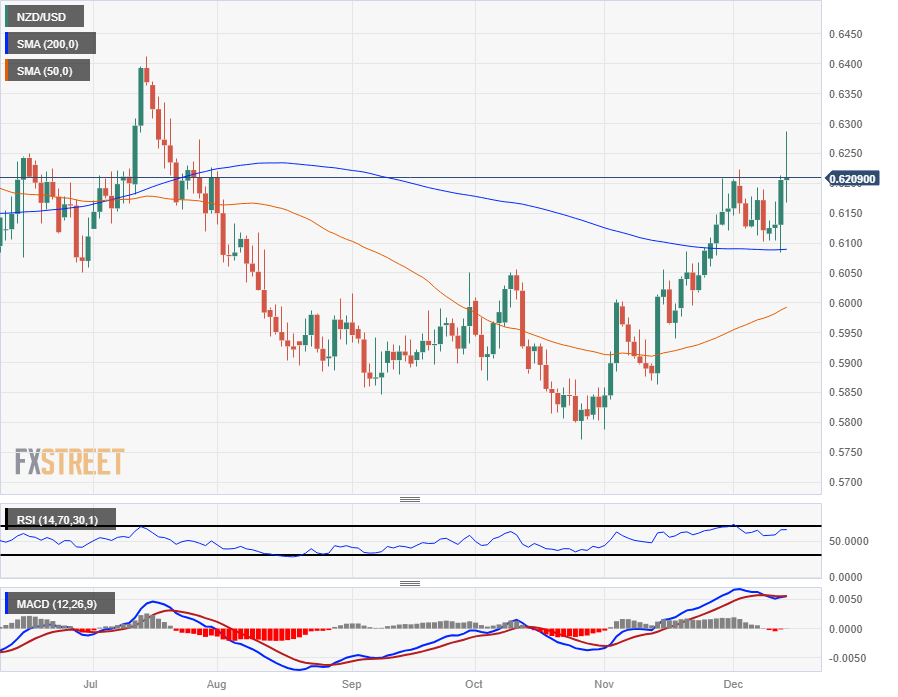
Near-term momentum still leans in favor of NZD/USD bidders with the pair up over seven and a half percent from October’s bottom bids near 0.5770, but evaporating bullish momentum leaves the pair set to consolidate just above the 200-day SMA near 0.6100.
NZD/USD Hourly Chart

NZD/USD Daily Chart

NZD/USD Technical Levels