NZD/USD mired in congestion near 0.6200
- NZD/USD set to finish 2023 near a popular congestion level.
- New Zealand Trade Balance figures softened early Tuesday, limiting Kiwi bulls.
- This week’s key focus will be US PCE inflation heading into the market holiday.
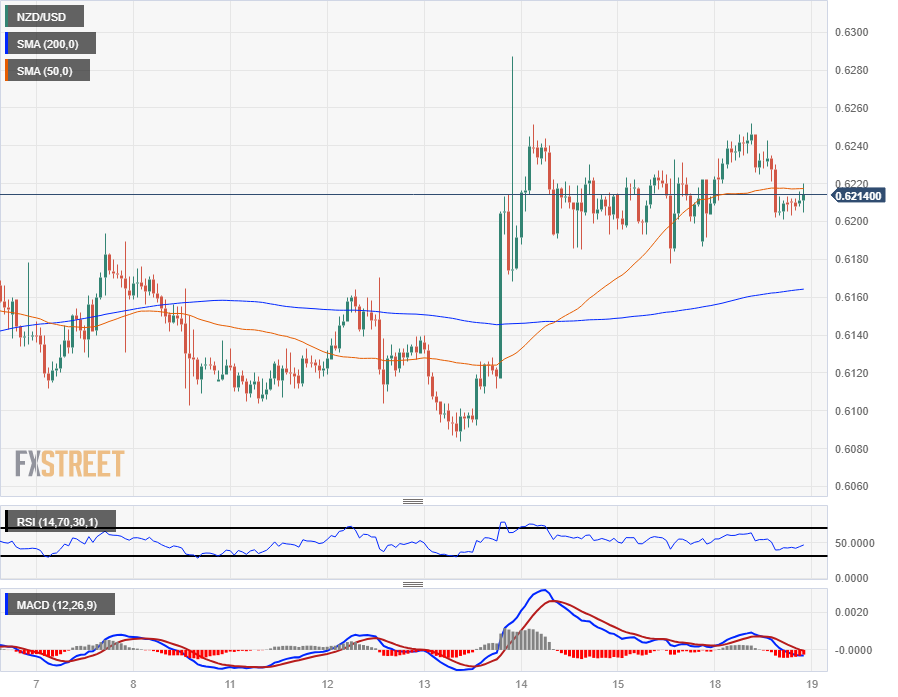
The NZD/USD sees thin trading in early Tuesday market action, constrained in the 0.6200 neighborhood after slipping from 0.6250.
Further declines aren’t immediately on the card for the Kiwi (NZD) rounding out the early trading week, but disappointing trade figures from New Zealand are doing little to encourage would-be Kiwi bidders.
New Zealand Trade Balance declines $1.234B versus $-1.2B forecast as goods trade slumps
New Zealand’s Trade Balance saw declines through 2023, with both imports and exports falling. Kiwi buyers will have a hard time finding a reason to bid heading through the week, but the majority of market participants will be watching the US Dollar (USD) anyway with one last blast of US inflation data due at the week’s end.
US Personal Consumption Expenditure (PCE) inflation figures, the Federal Reserve’s favored method of tracking inflation, will drop on Friday. US PCE Price Index numbers are expected to hold steady at 0.2% for November, while the PCE Price Index for the year ended November is forecast tick down slightly from 3.5% to 3.3%.
Little else of note exists on the New Zealand data docket this week, although Wednesday’s early Asia market session will see the latest ANZ Roy Morgan Consumer Confidence update for December, which last printed at 91.9 in November.
NZD/USD Technical Outlook
The Kiwi waffled on Monday, pinned to 0.6200 after slipping back from the day’s early peak near 0.6250. Intraday price action has seen the 200-hour Simple Moving Average (SMA) flip from resistance to support near 0.6165, but topside momentum remains limited in the near-term.
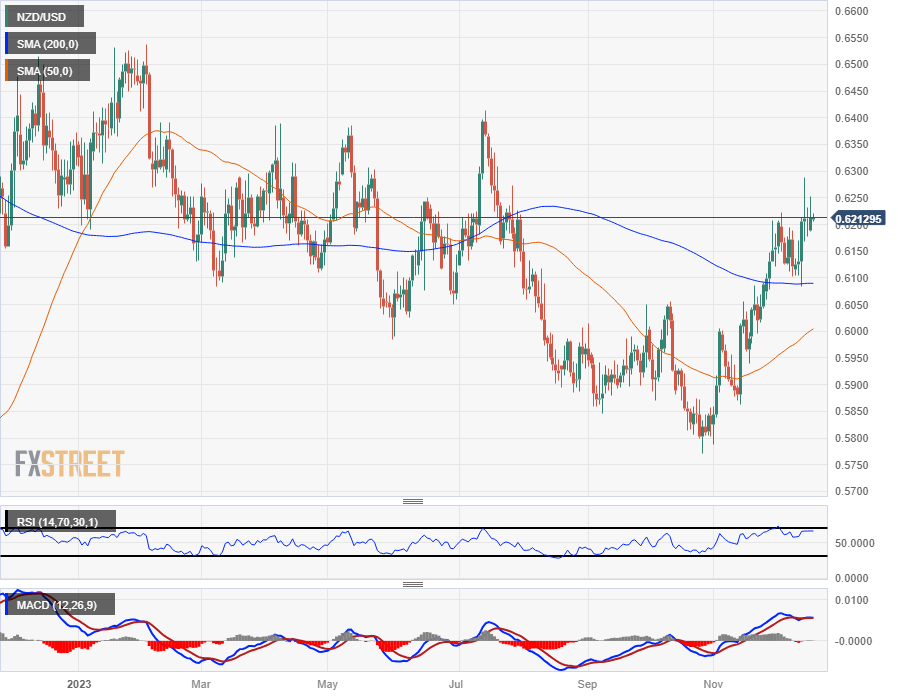
The NZD/USD is trading on the top side of the 200-day SMA just south of the 0.6100 handle, and the pair has climbed over 7.5% from late October’s bottom bids of 0.5772. Despite the climb, the pair remains mired in familiar congestion for most of 2023, and chart paper north of the 200-day SMA has proven frictional, with little in the way of real gains.
NZD/USD Hourly Chart

NZD/USD Daily Chart

NZD/USD Technical Levels