NZD/JPY bears continue on the sidelines, bullish momentum limited
- The NZD/JPY was observed rallying upward by 0.50% towards 88.70 on Monday.
- Indicators on the daily chart reveal a positive yet limited buying momentum.
- The broader outlook suggests bullish control.
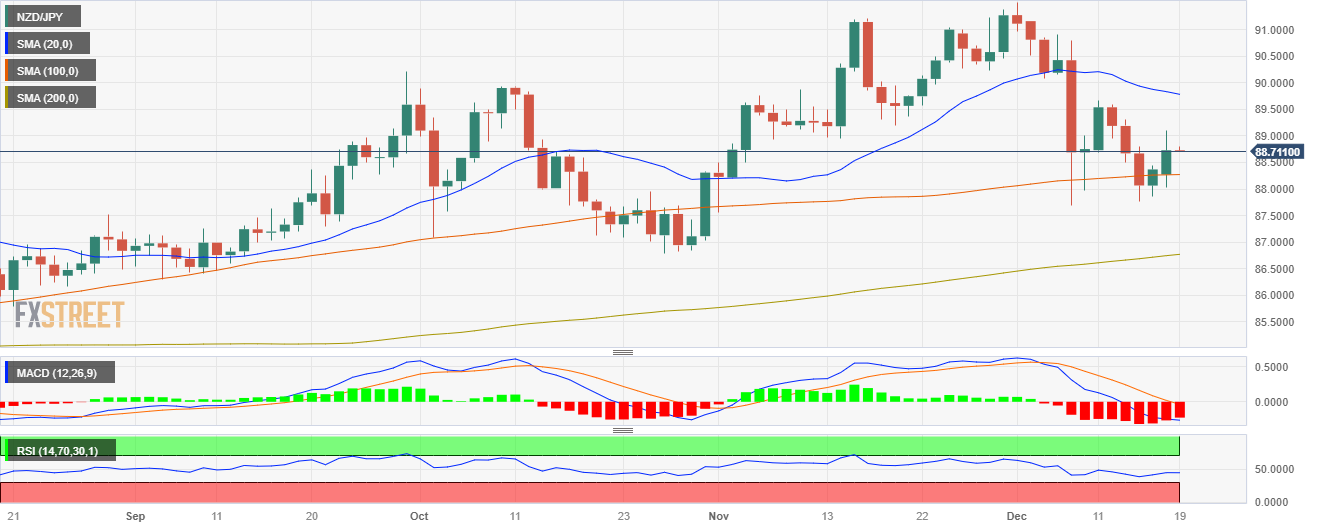
On Monday's session, the NZD/JPY pair traded at 88.72, experiencing a slight 0.52% rally. The daily chart reveals a neutral to bearish outlook, as the bears are taking a breather after a 1.30% plunge last week. In the four-hour chart, momentum has significantly flattened despite earlier gains.
On the daily chart, the Relative Strength Index (RSI) displays a positive slope yet remains in negative territory, an indication that selling pressure has somewhat alleviated but is still in play. Meanwhile, the flat-red histogram of the Moving Average Convergence Divergence (MACD) echoes this hesitation in the bearish momentum. However, the pair's position regarding its Simple Moving Averages (SMAs) reveals mixed signals. The pair holding a position below the 20-day SMA yet remaining above the 100 and 200-day SMAs paints a picture of bulls hibernating on a broader horizon, preparing to gain momentum and seize control from the consolidating bears who, after pushing the pair down by 1.30% in recent sessions, appear to be taking a breather.
Shifting to the four-hour chart, a similar theme of subdued momentum is seen. The key indicators, though having gained significant traction to the upside, turned flat. The four-hour RSI and MACD maintain their positions in positive territory yet remain flat - a scenario suggesting the buying pressure lost steam. Despite the minor pause, the positive positioning of the indicators hints that the dominating force may likely start to lean towards buying momentum in the short term.
Support Levels: 88.260 (100-day SMA), 86.750 (200-day SMA), 86.130.
Resistance Levels: 89.810 (20-day SMA), 90.930, 91.000.
NZD/JPY daily chart
