USD/JPY swamped near 144.00 after failing to vault over 145.00 on Tuesday
- USD/JPY sees plenty of chart churn after BoJ fails to meet market tone expectations.
- Recent hawkish comments from BoJ Governor Ueda pivoted to usual dovishness, slapping down overeager Yen bets.
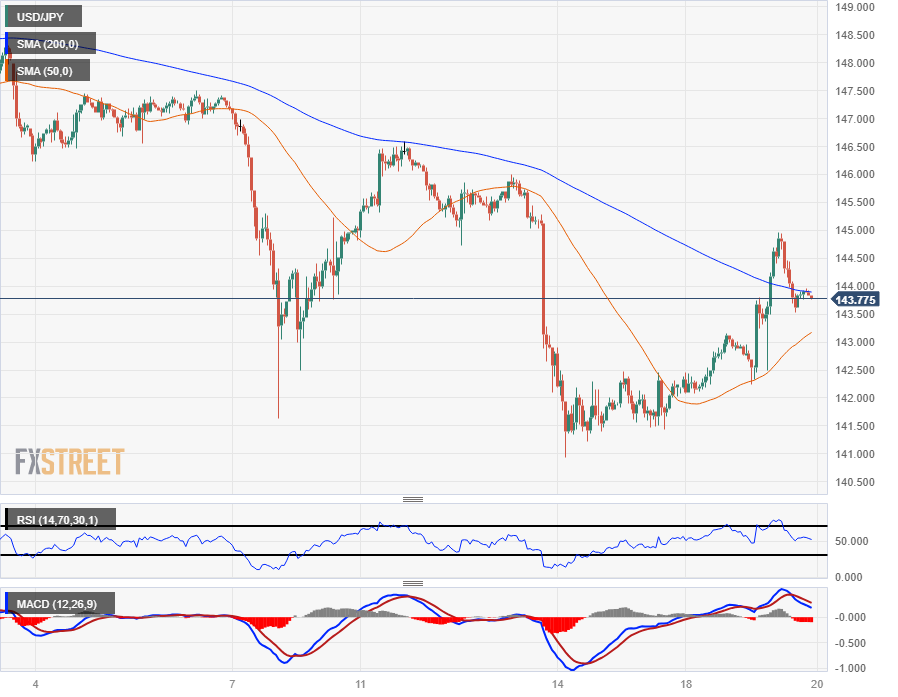
- 200-hour SMA proving a tricky barrier to overcome.
USD/JPY saw a hard rally early Tuesday after the Bank of Japan (BoJ) cut the knees out from underneath soaring market expectations of an unexpected hawkish pivot sparked by recent comments from BoJ Governor Kazuo Ueda, who noted that the BoJ's current monetary policy framework could see some tightening at some point in the future if the macro data favors it.
Market participants promptly ran far ahead of current market conditions, with investors pivoting about-face last week looking for signs that the BoJ would begin easing towards a tightening cycle.
Governor Ueda's comments proved to be further flung than investors were prepared to admit after that BoJ's latest Monetary Policy Statement and follow-up Press Conference revealed that the specific economic conditions required for a tightening shift from the BoJ are currently not present, and remain a lofty future goal rather than an imminent dynamic adjustment.
The Yen (JPY) tumbled nearly 2% peak-to-trough against the US Dollar after markets rebalanced their Yenb expectations once again.
BoJ’s Ueda: Want to see if next spring's wage growth is strong enough to support consumption
According to Governor Ueda, the BoJ is waiting to see how wage growth develops through 2024's first quarter and heading into the second before making any assessments regarding policy changes.
This fell well short of market expectations which had ramped up into “imminently hawkish BoJ” hopes after Ueda briefly mentioned a possible end to the negative rate regime at some point in the future.
The rest of the trading week turns to face a final raft of US economic data heading into the final week of trading in 2023, with US Gross Domestic Product (GDP) and Personal Consumption Expenditure (PCE) Price Index figures due on Thursday and Friday, respectively.
US GDP is expected to hold steady at 5.2% for the annualized period ending in the third quarter, while US PCE Index numbers, the Federal Reserve’s favored method of tracking domestic inflation, are expected to slightly tick down from 3.5% to 3.3% for the year ended November.
USD/JPY Technical Outlook
Intraday action finds the USD/JPY pinned into the 200-day Simple Moving Average (SMA) near the 144.00 handle, after hitting a Tuesday high that fell just shy of the 145.00 major price level.
Near-term momentum has leaned bullish for the USD/JPY, but topside momentum remains capped below the last notable swing high into 146.50 last week.
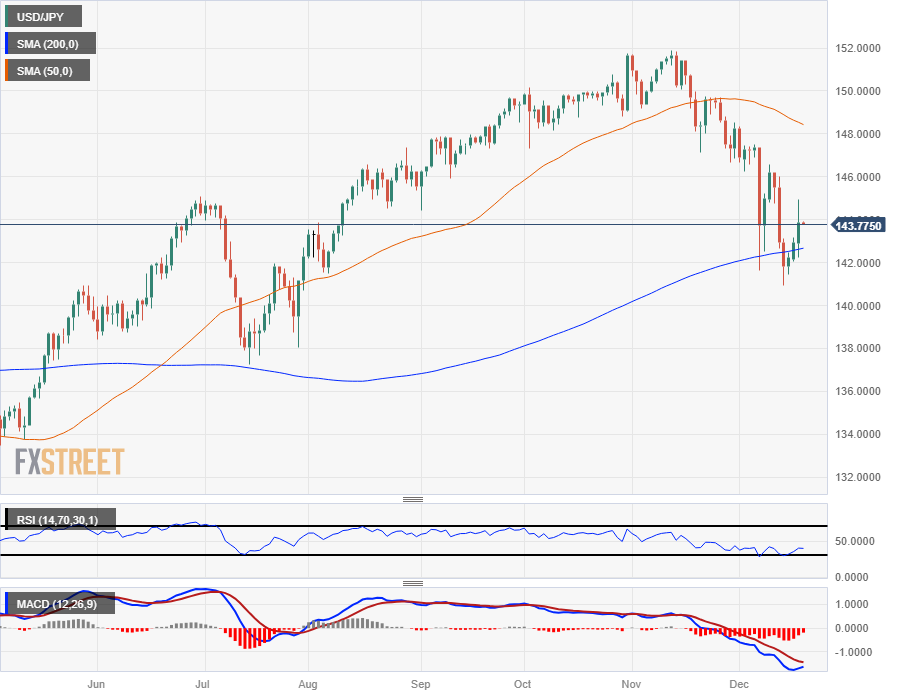
Daily candlesticks show the USD/JPY churning at the 200-day SMA as medium-term momentum drains out of the pair, leaving bids to waffle into long-term median prices.
USD/JPY Hourly Chart

USD/JPY Daily Chart

USD/JPY Technical Levels