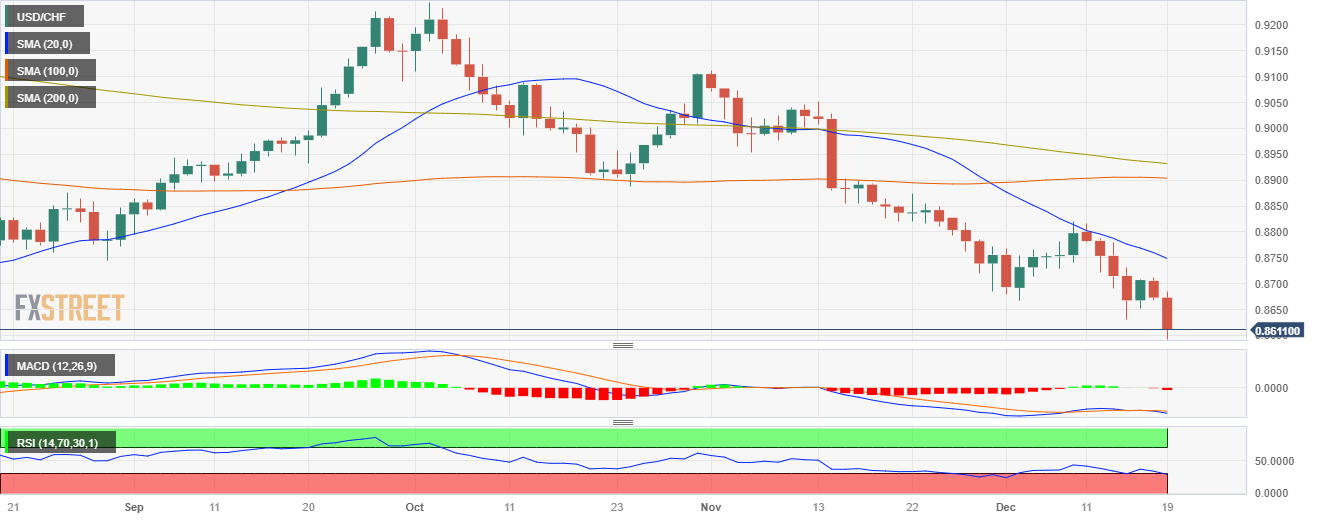
USD/CHF sinks to fresh multi-month lows near 0.8600
- The USD/CHF saw a 0.70% decrease, hitting fresh multi-month lows around 0.8610.
- Thomas Barkin's dovish comments and lower US yields are weighing on the US Dollar.
- Raphael Bostic lowered the dovish hype and commented that the bank should be ‘patient’.
In Tuesday's session, the USD/CHF plunged to fresh multi-month lows of 0.8610, marking a 0.70% daily decline. This downward movement was mainly by dovish bets on the Federal Reserve (Fed) spurred remarks from Thomas Barkin, which weighs on the US Dollar.
In that sense, the Federal Reserve hinted in its last Wednesday’s meeting that there likely won’t be any additional tightening, and the revised dot plots saw the bank’s officials forecasting 75 bps of easing in 2024. Since then, the US Dollar is under selling pressure, and any dovish guidance adds additional pressure to the Greenback. In line with that, Thomas Barkin commented on Tuesday that in case inflation continues declining, the Fed will “respond,” which fueled further expectations of easing. On the other hand, Raphael Bostic from Atlanta’s Fed sounded more cautious and warned that the policy needs to be “ resolute and patient” and that he sees only two rate cuts in 2024.
Meanwhile, US bond yields are presently trading lower. The 2-year rate is at 4.40%, while the 5 and 10-year rates are posted at 3.94% and 3.92% respectively. This downward trend of the US yields contributes to the downside of the pair as the US Dollar loses interest.
However, the Swiss economy, like much of Europe, is contracting with falling business confidence and investment, particularly in energy-intensive industries. These factors would potentially strengthen the USD against the CHF as the American economy is holding strong. On Wednesday, investors will watch the Swiss National Bank (SNB) Quarterly Bulletin from Q4 to get further insights on the economy.
USD/CHF levels to watch
The indicators on the daily chart reflect a dominant bearish momentum in the short term. The Relative Strength Index (RSI) is sending signals of an oversold market, frequently suggesting a nearing reversal or a temporary shift in the trend.
Adding to the bearish presence, the Moving Average Convergence Divergence (MACD) is also pointing toward increased selling pressure. The MACD's oversold conditions are represented by the prolonged printing of the red bars in the histogram, denoting a momentum that currently favors the sellers.
Further reinforcing this sentiment, the pair is situated below the 20, 100, and 200-day Simple Moving Averages (SMAs). The position distinctly signals that the bears are still in control in a larger context. This scenario, aligned with the mentioned indicators, signifies the continuation of a challenging environment for buyers.
Support Levels: 0.8600, 0.8550, 0.8500.
Resistance Levels: 0.8650, 0.8700, 0.8746 (20-day SMA).
USD/CHF daily chart
