AUD/USD rises on hawkish RBA December minutes
- The AUD/USD continues to edge higher, trading near the 0.6770 mark following a 0.90% rally.
- RBA's hawkish tone in December escalates AUD's strength.
- Monetary policy divergences between the Fed and the RBA may continue pushing the pair to the upside.
During Tuesday's session, the AUD/USD pair had a notable rally and jumped towards 0.6770. This surge in the Aussie dollar can be attributed to the hawkish minutes released by the Australian Reserve Bank (RBA), which gave the currency a significant push against its US counterpart.
In line with that, the Reserve Bank of Australia (RBA) maintained its interest rate at 4.35% during its December 5 meeting, initially perceived as dovish. On Tuesday, the minutes revealed a hawkish stance, showing the bank considered a rate hike but ultimately opted to await more data to consider another hike.
Regarding the market expectations on the RBA, as indicated by the World Interest Rate Probability Tool (WIRP), suggest a low probability of a rate cut on February 6, followed by higher chances of easing in the May and June's meetings while a rate cut is already priced in for the November meeting in 2024..
This aligns with markets betting on a less aggressive Federal Reserve (Fed) and with investors contemplating rate cuts in early 2024 after the bank's fresh interest rate projections forecast 75 basis points of easing. In that sense, monetary policy divergences seem to be favoring the Aussie over the US Dollar.
AUD/USD levels to watch
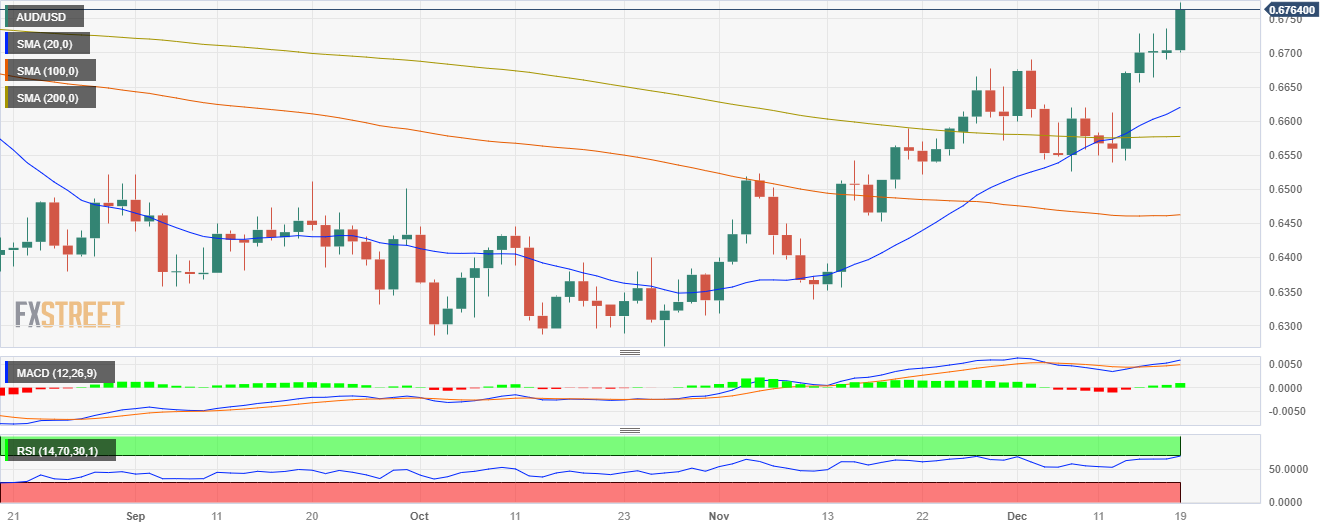
The daily chart indicates a dominating bullish momentum for the pair, shown by its position above the 20,100 and 200-day Simple Moving Averages (SMAs).
Regarding the daily Relative Strength Index (RSI), it flashes overbought conditions, suggesting that the pair may be primed for a pullback or at least a slowing down period, allowing the bulls a momentary breather before pushing further. In addition, the Moving Average Convergence Divergence (MACD) displays similar conditions, which typically indicates a potential waning in the uptrend.
Support Levels: 0.6620 (20-day SMA), 0.6600, 0.6570 (200-day SMA).
Resistance Levels: 0.6800, 0.6850, 0.6900.
AUD/USD daily chart
