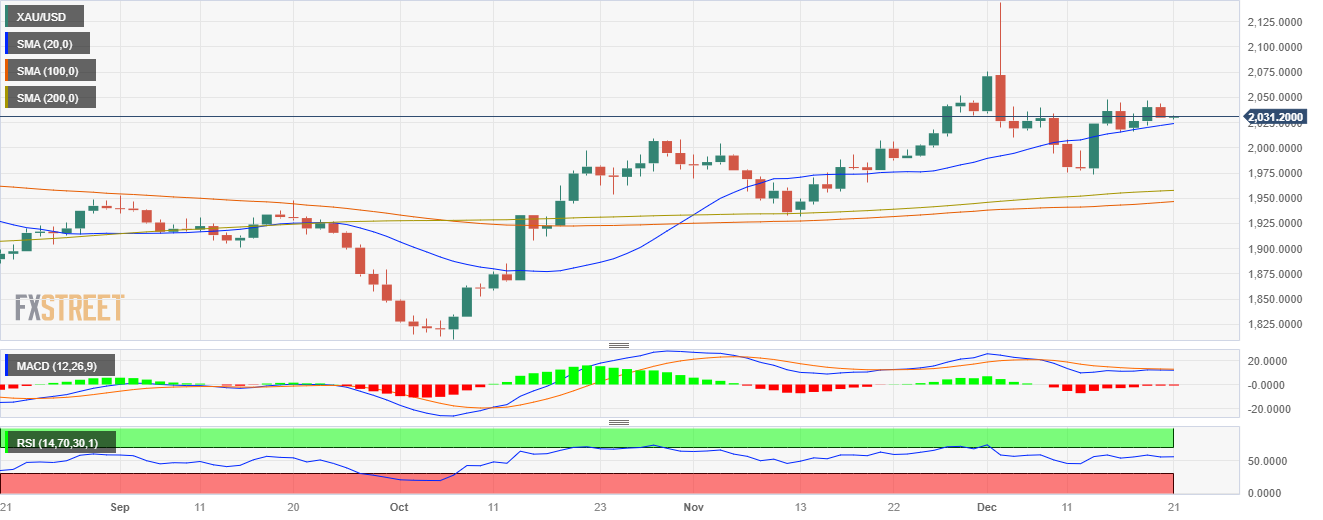
Gold Price Forecast: XAU/USD consolidates gains and threatens the 20-day SMA
- The XAU/USD sees a downward shift to around the $2030 level, highlighting a 0.55% decline.
- US yields show weakness, which may limit the downside for the metal.
- Markets are bracing for Friday's inflation data, which is likely to set the pace of the price dynamics for the short term.
In Wednesday's trading session, the XAU/USD Gold spot price witnessed a strong downward trend, currently trading at approximately $2,030. Buyers seem to be taking a step back to consolidate gains as the price stands at highs since May.
Market participants continue to be on edge as they await the release of the US Personal Consumption Expenditures (PCE) figures from November, much favored by the Federal Reserve as a key indicator of inflation, due on Friday. The outcome may have an impact on the metals price as it could confirm the markets bet on sooner rate cuts by the Fed in 2024.
Meanwhile, due to the Fed’s dovish shifts, US yields are weak, providing a cushion to the yellow metal as falling US Treasury bond yields tend to ease the opportunity cost of holding non-yielding metals. The 2-year rate is hovering at 4.40%, while the 5 and 10-year yields are at 3.85% and 3.84% (low since July) respectively.
XAU/USD levels to watch
The daily Relative Strength Index (RSI), despite its negative slope, remains in positive territory while the Moving Average Convergence Divergence (MACD) histogram lays out red bars which reaffirm an underlying buying pressure; however, their flat nature implies a pause in momentum.
Zooming out, the Simple Moving Averages (SMAs) further implicate a bullish stance. Specifically, the pair is notably above the 20,100 and 200-day SMA, suggesting that the buyers still dominate the larger time frames.
Support Levels: $2,020 (20-day SMA), $2,000, $1,980.
Resistance Levels: $2,040, $2,050, $2,070.
XAU/USD daily chart
